Figure 1.

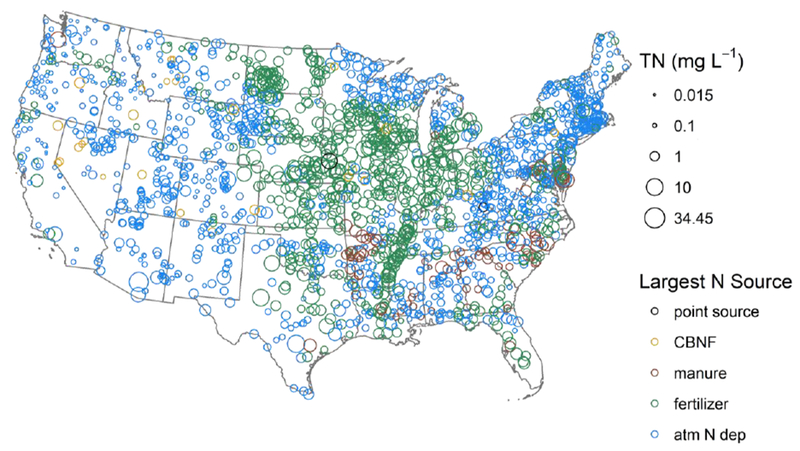
TN concentrations at NRSA sampling locations (n=1966). The color corresponds to the single largest N source to the watershed. CBNF is Cultivated biological N fixation.

TN concentrations at NRSA sampling locations (n=1966). The color corresponds to the single largest N source to the watershed. CBNF is Cultivated biological N fixation.