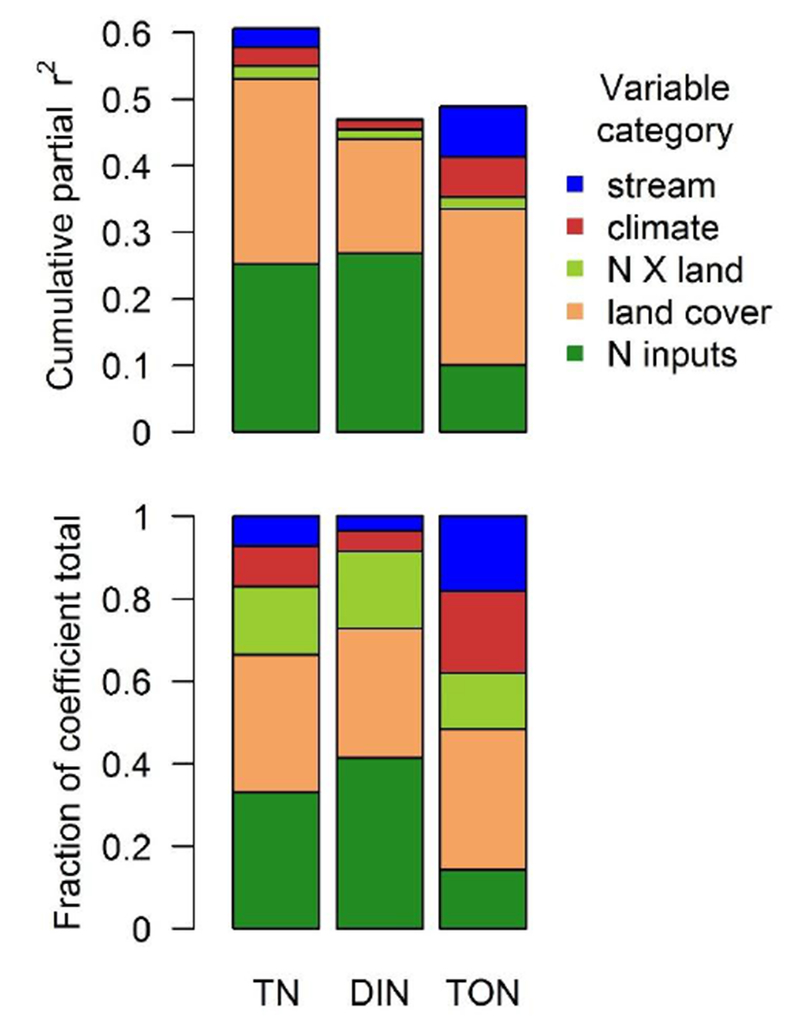
Figure 4.

Top: Cumulative partial r2 values for each category of predictor variables. The total bar reflects the model r2. Bottom: Fraction of the total sum of standardized coefficients (absolute values) corresponding to each category of predictor variables. Standardized coefficients can be interpreted as relative effect size on the dependent variable. Variable categories are: stream (average annual discharge, % lake cover, mean substrate size), climate (mean annual temperature and precipitation), land cover (forest, wetland and impervious percent cover and riparian disturbance percent) N inputs (agricultural N, atmospheric deposition N, and point source N), and “N X land” corresponds to the effects of interactions between N inputs and land cover (agricultural N x wetland cover, agricultural N x riparian disturbance, atmospheric N x forest cover, and atmospheric N x impervious cover).
