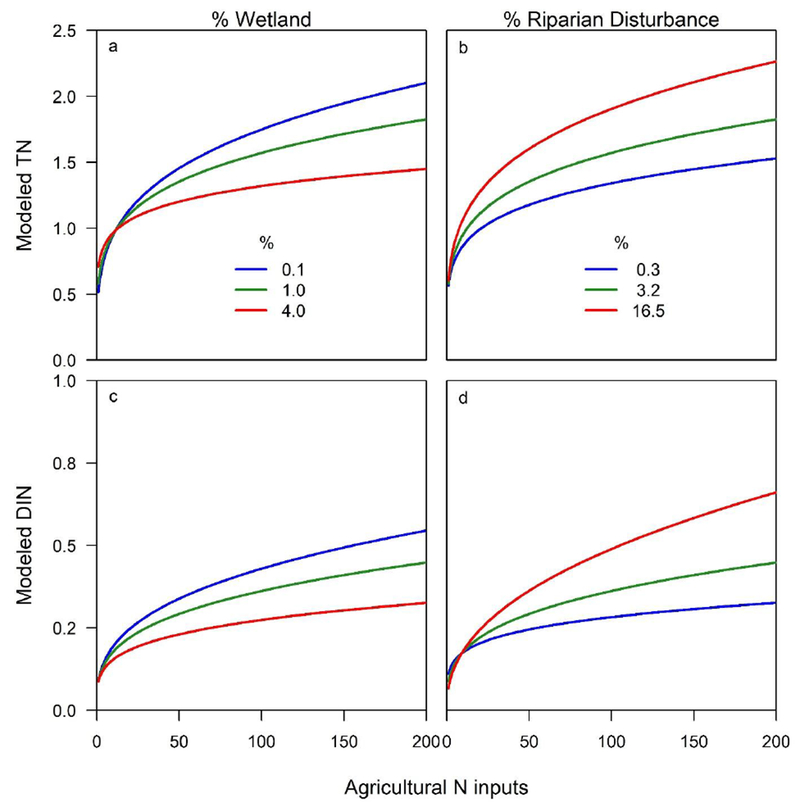
Figure 5.

Estimated response of TN (a and b) and DIN (c and d) in mg N L−1 to increasing agricultural inputs (kg N ha−1 y−1), across 3 levels of wetland cover (a and c) and riparian disturbance (b and d) based on multiple regression model coefficients (Table 2). The low, medium, and high values correspond to the 1st, 2nd, and 3rd quartiles of wetland or riparian cover in the data set, while all other variables are set to their median values (Table 1). Agricultural N is the sum of fertilizer, cultivated biological N fixation, and manure N inputs.
