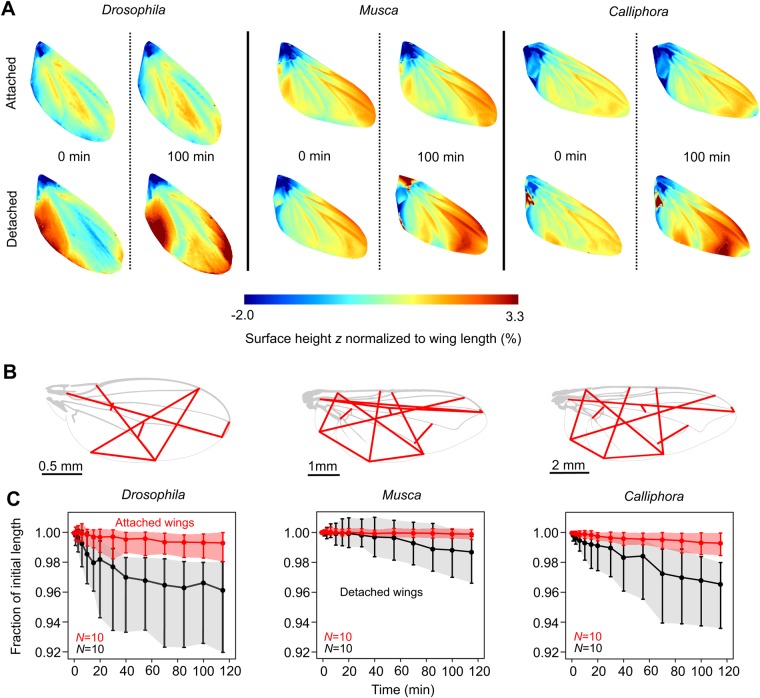
Fig. 1.
Wing surface changes during desiccation. (A) Initial surface height values (z-values) and after 100 min in wings attached to intact, living animals (upper row) and detached wings (lower row). Surface values are normalized to wing length i.e. ∼2.15 mm in Drosophila, ∼6.28 mm in Musca and ∼9.29 mm in Calliphora (Table 1). (B) Lines (red) for estimation of wing deformation during desiccation. Wing images are captured by a photo camera from the top. (C) Mean relative length change of lines in B in detached wings (black) and wings of intact animals (red). Data are medians and shaded areas indicate lower and upper quartiles. N, number of tested flies.

