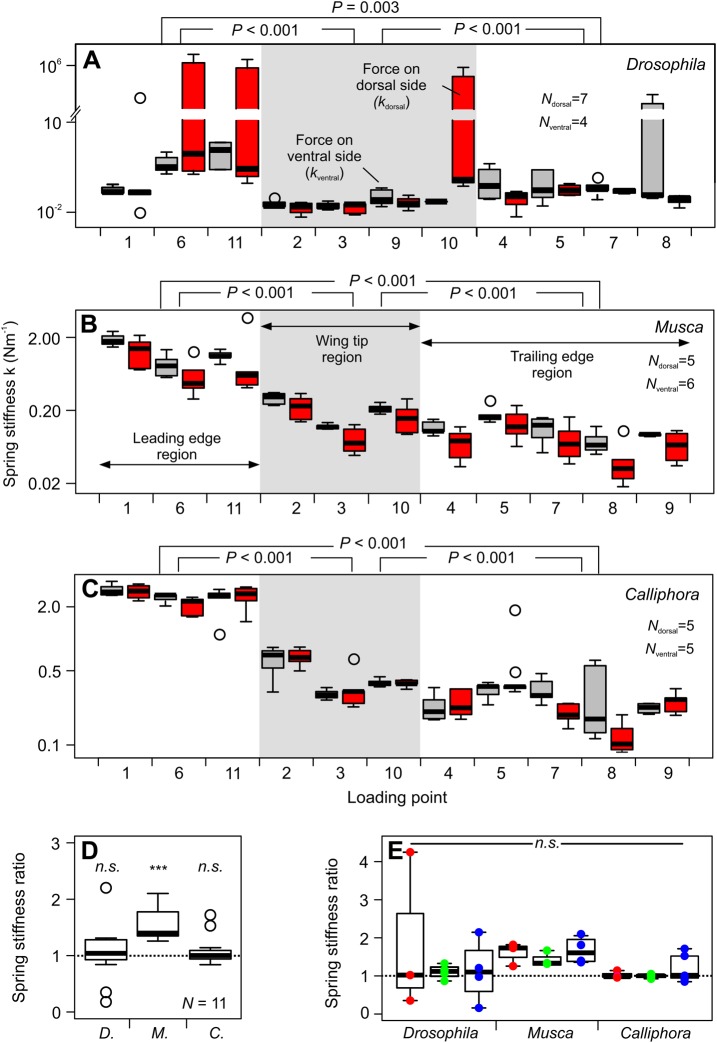
Fig. 5.
Wing spring stiffness along various bending lines and anisotropy. (A–C) Stiffness was calculated along bending lines from the wing base to the various load points. See Table 2 for site-specific target force. Loading forces are applied on the wing’s ventral (gray) and dorsal (red) side. Load points are grouped into three major wing regions (see Materials and Methods). (D) Anisotropy for all loaded points calculated from the ratio in spring stiffness (kventral/kdorsal) derived from loading the ventral (kventral) and dorsal wing side (kdorsal, N=11 load points). (E) Anisotropy of three wing regions (red, leading wing edge region, N=3 flies, all species); green, wing tip region, N=4 Drosophila, N=3 Musca, N=3 Calliphora; blue, trailing edge region, N=4 Drosophila, N=5 Musca, N=5 Calliphora, see Materials and Methods. All data are boxplots with medians and upper and lower quartiles. Open circles are outliers. ***P<0.001; n.s., not significant. D., Drosophila; M., Musca; C., Calliphora.

