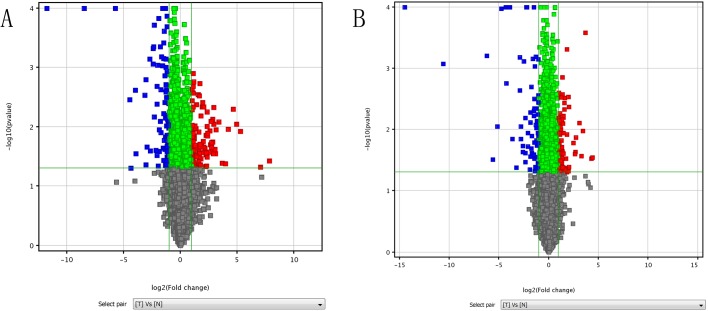
Fig. 1.
Identification of lncRNAs and mRNAs differentially expressed in NFPA. The expression profiles of lncRNAs and mRNAs were compared between non-functioning pituitary adenoma (NFPA) and normal pituitary (NP) using formalin-fixed and paraffin-embedded (FFPE) tissue specimens. Volcano plot of lncRNAs (A) and mRNAs (B) illustrate the change in the expression level of each transcript (represented as a single square), when its expression in NFPA is compared to its respective expression in NP. The horizontal axis represents fold of change in expression (on a log2 scale); the green vertical line on the left thus represents a twofold downregulation, and the green vertical line on the right represents a twofold upregulation. The vertical axis represents P value (on a negative log10 scale); the green horizontal line thus represents a P value of 0.05. The red squares thus represent transcripts significantly upregulated in NFPA, and the blue squares represent transcripts significantly downregulated in NFPA, based on our statistical criteria.

