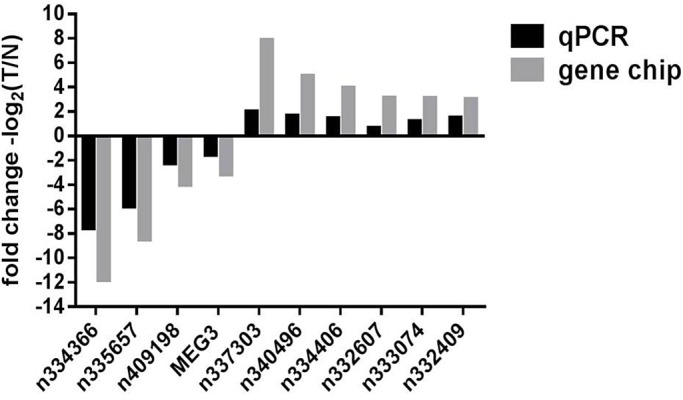
Fig. 3.

Validation of differentially expressed lncRNAs using qRT-PCR. The expression levels of ten individual lncRNAs were compared between non-functioning pituitary adenoma (NFPA) and normal pituitary (NP) using formalin-fixed and paraffin-embedded (FFPE) tissue specimens. The change in the expression level of each lncRNA, when its expression in NFPA is compared to its respective expression in NP, is illustrated as a vertical bar. The vertical axis represents fold of change in expression (on a log2 scale). Black bars represent qRT-PCR results, which validated microarray results (gray bars).
