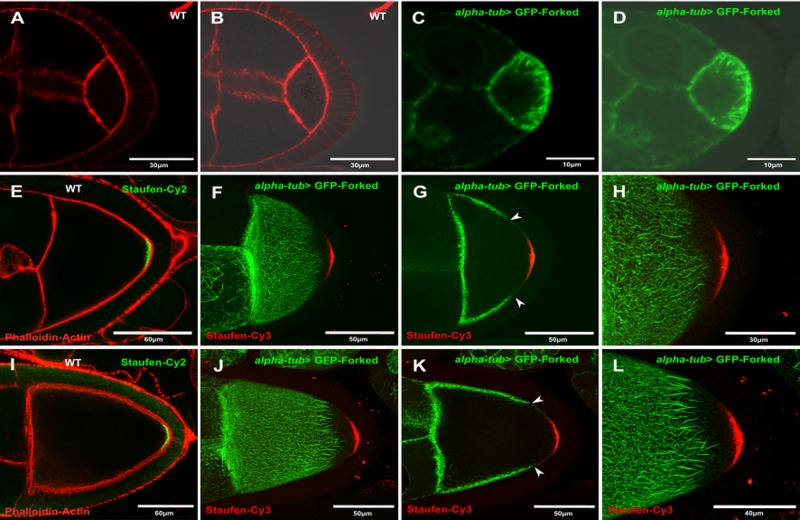
Fig. 2.
Forked marks a distinct asymmetric network in oocytes. Confocal images from (A,B) WT stage 5 egg chambers stained with phalloidin (red; A); B is the image shown in A seen with DIC. (C,D) alpha-tub> GFP-Forked stage 5; D is the merged image of C seen with DIC. WT stage 9 (E) and stage 10 (I) egg chambers stained with phalloidin (red; E,I) and anti-Staufen antibodies (green; E,I). alpha-tub> GFP-Forked stage 9 (F–H) and stage 10 (J–L) egg chambers were stained with anti-Cy3-conjgated anti-Staufen antibodies. Images (F,J) and (H,L) are confocal Z-series projections. (G) and (K) show single confocal slices from the Z-series projections of images (F) and (J), respectively. Arrowheads in (G) and (K) point towards the limit of the asymmetric network marked by GFP-Forked.

