Fig. 2.
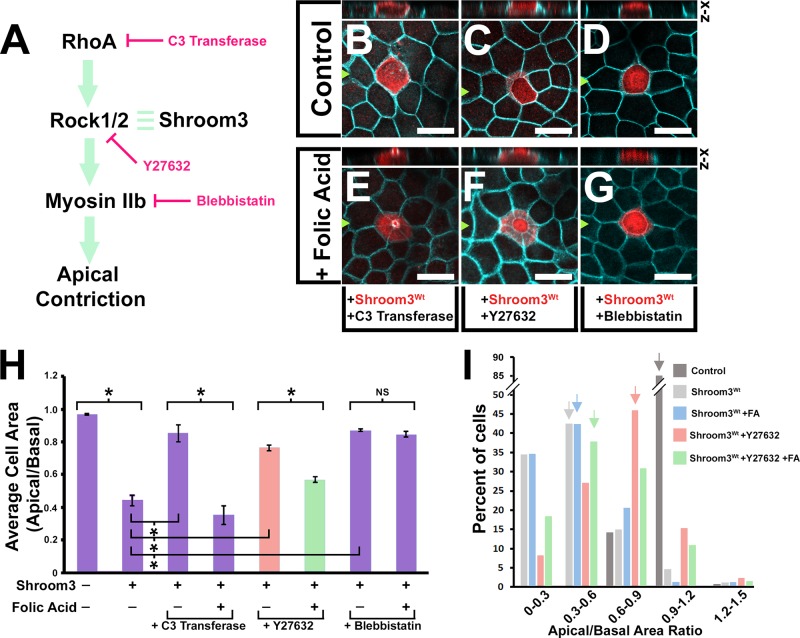
Folic acid rescue is independent of RhoA and Rho-kinase activity. (A) A diagram of the Shroom3-dependent apical constriction pathway marked with the locations of chemical inhibition. (B–G) Apical views of MDCK cells transfected with a Shroom3wt-expression vector, incubated with or without exogenous folic acid (100 µM) and the indicated chemical inhibitor, and immunofluorescently labeled with β-catenin (turquoise) and Shroom3 antibodies (red). Above each panel is a virtual section through the transgenic cell in the x-z plane. Scale bars: 20 µm. (H) The mean apical basal area ratio (ABAR) was calculated from area measurements of apical and basal images of transgenic cells and depicted in the graph. Asterisks indicate data sets with significant changes in ABAR ratios P<0.01. (I) The percentage of cells within specific ABAR increments are represented for the indicated experimental groups. Arrows mark the ABAR increment group with the greatest number of cells. Note that the experimental groups have distinct peak ABAR increment ranges indicating a shift in the population.

