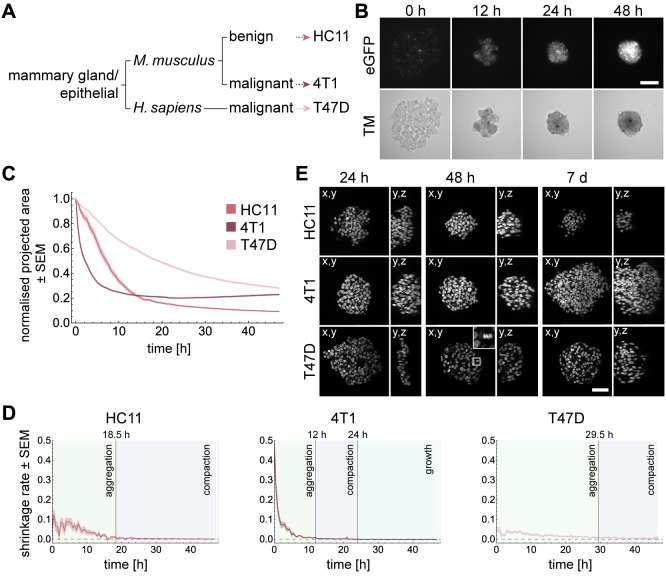
Fig. 1.
Spheroid formation differs strongly between cell lines. (A) Relationship between the cell lines regarding origin of tissue, species and phenotype. (B) Spheroid formation with HC11 cells for 48 h. Images show transmission channel and fluorescence channel of cell nuclei tagged with H2B-eGFP. Wide-field fluorescence microscopy: Carl Zeiss Cell Observer Z.1, objective: 10×/NA 0.5, time-lapse: 48 h, interval: 30 min, Scale bar: 50 µm. (C) Dynamics of the projected area occupied by HC11, 4T1 and T47D cells in DMSO normalised to the area at time 0 h. Shaded regions represent the standard error of the mean (SEM). Number of independent experiments for HC11, 4T1 and T47D cells: 30, 40, 30. (D) The shrinkage rate was approximated by ΔNA/Δt, where ΔNA is the difference of the normalised area between two time points and Δt the time step. The transition between aggregation and compaction phase is reached when the shrinkage rate drops below 0.008. The growth phase is reached when the shrinkage rate is below zero. (E) Views along different directions show spheroid dimensions at 24 h, 48 h and 7 days of formation. The 4× magnified section shows a mitotic cell. Microscope: Zeiss LSM780, objective: 40×/NA 1.3 oil, Scale bar: 50 µm.

