
Fig. 5.
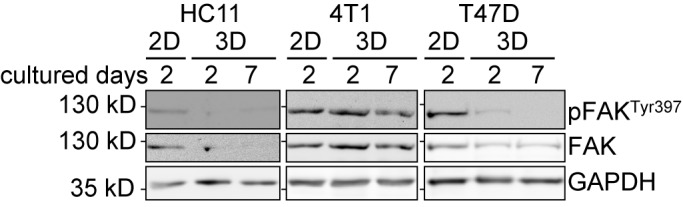
FAK expression and FAK phosphorylation differ between cell lines and culturing methods. Immunoblot analysis was performed with protein extracts from monolayers and spheroid cultures. Cells were lysed in RIPA buffer and analysed by SDS-PAGE. Antibodies against FAK and pFAKTyr397 were used. GAPDH is shown as the loading control. Cell lysates from different cell lines were loaded onto different gels. Protein lysates from all conditions of a cell line were loaded onto the same gel. Uncropped data is shown in Fig. S8, quantitative densitometry data is shown in Table. S3.