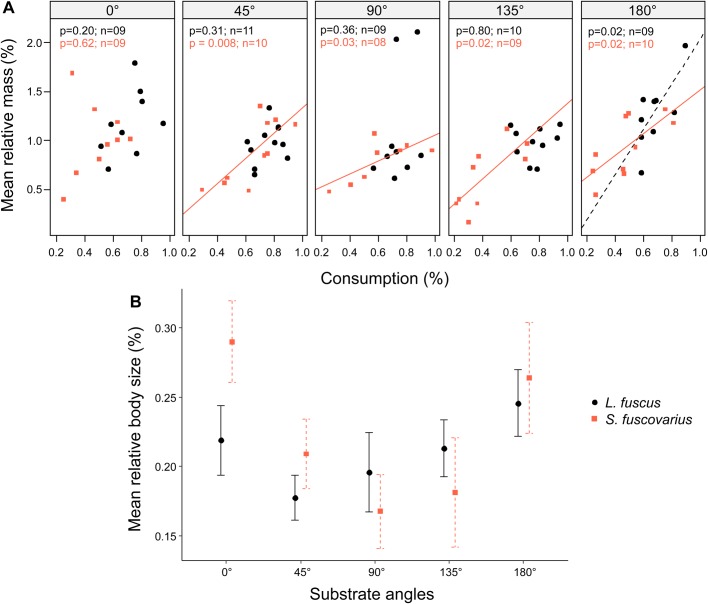
Fig. 1.
Effect of substrate orientation on growth rate of bottom-dwelling (L. fuscus) and midwater (S. fuscovarius) tadpoles that have similar external oral morphology. The legend identifies the species for both graphs. (A) Relative mass versus percentage of food consumed by orientation of the substrates (two-way ANCOVA). Solid and dashed lines represent significant regression lines between relative mass and food consumption by treatment. The probability values (P) for this relationship and the number of tadpoles tested (n) are presented in respective colors to each species in the panels. Symbols (circles and squares) represent each individual. (B) Relative body size versus percentage of food consumed by orientation of the substrates (two-way ANOVA). Symbols represent mean values and bars indicate standard error. Species had similar growth rates (A,B, P>0.05), but performed better feeding on horizontal substrates (A,B, P<0.05).

