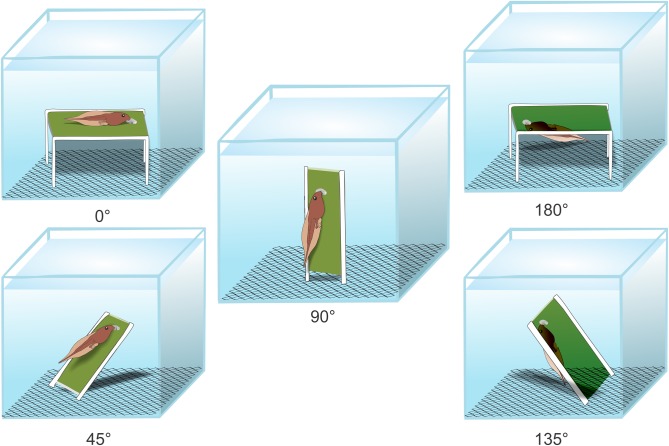
Fig. 7.
Experiment design. Schematic drawing (not to scale) for tadpole feeding during the experiments. Each treatment is represented by one tadpole in a glass aquarium. The green bar represents the food on a microscope slide, oriented by the plastic supports (in white) on a metal screen at the bottom of the aquarium. The spot in the green bar represents the mark that tadpoles leave on the slide after removing food.

