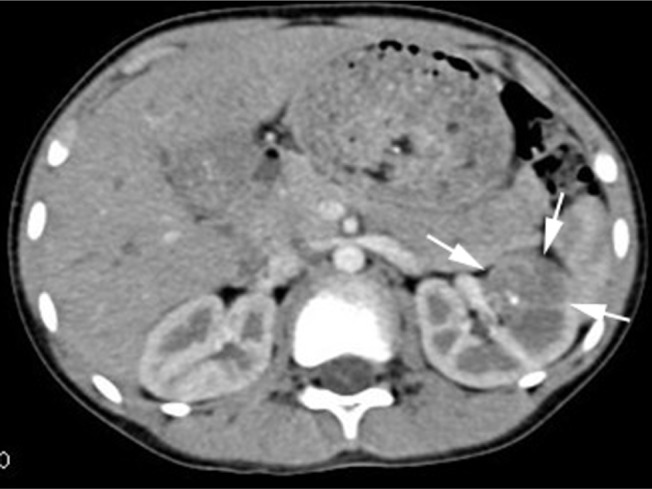
Figure 1.

A computed tomography image, with intravenous contrast.
Note: The mass in the left renal middle pole is shown (white arrows).

A computed tomography image, with intravenous contrast.
Note: The mass in the left renal middle pole is shown (white arrows).