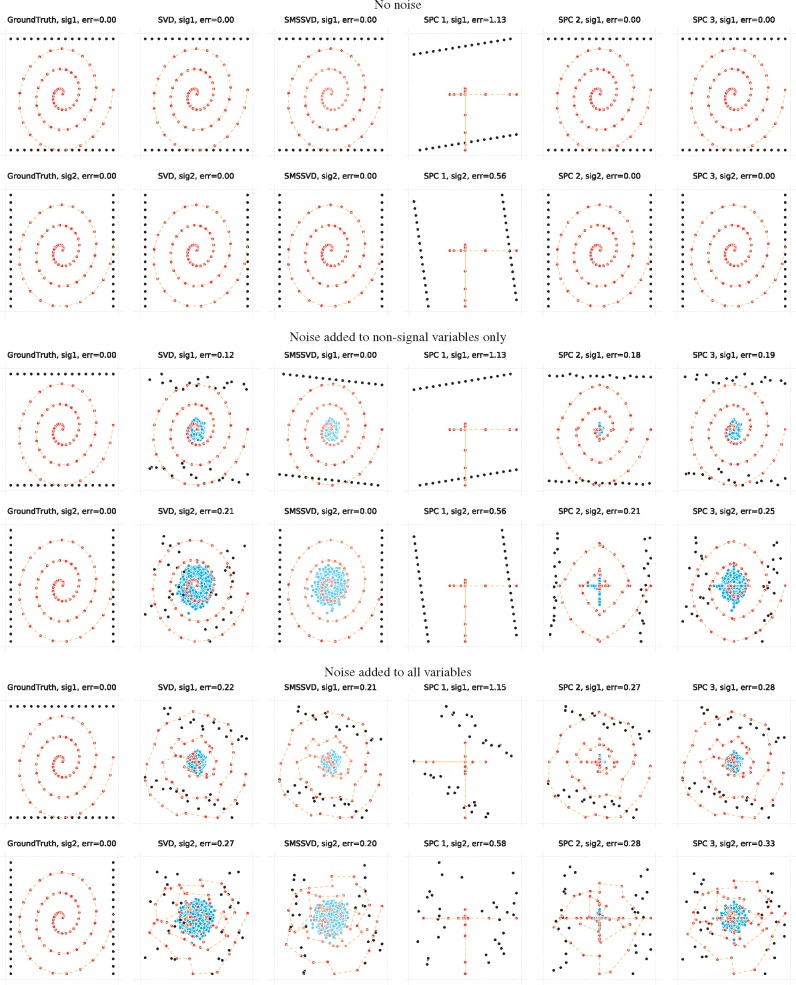
Fig. 4.
Two 2d signals with non-overlapping support for the variables are shown for no noise (Upper two rows), noise added to non-signal variables only (Middle two rows) and for noise added to all variables (Lower two rows). The reconstruction of the first signal is shown in the upper row and for the second signal in the lower row in each set. Different columns correspond to different methods, where SPC ‘1’, ‘2’ and ‘3’ have regularization penalties of c = 2, 8 and 32 respectively, controlling the degree of sparsity. Samples are black, variables where the signal has support are red and other variables are blue. The variables in the support are connected with dashed lines, only to make it easier to spot how the variables are influenced by noise. For SMSSVD, variables selected by optimal variance filtering are shown in full color and other variables are shown in a whiter tone. Samples and variables are both scaled to fill the axes in each biplot. 32 samples and 5000 variables were used, of which each signal had support in 64 variables and the rest had noise only

