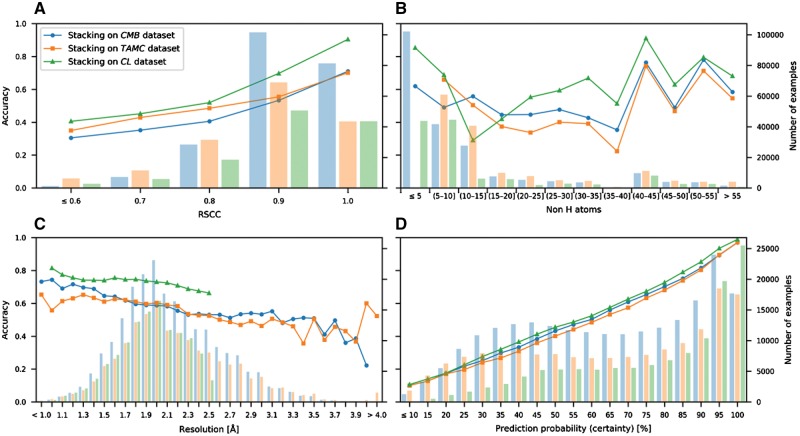
Fig. 4.
Recognition rates. CheckMyBlob ligand recognition rates (accuracy, shown as points) and ligand distributions (number of examples, shown as histograms) versus (A) real-space correlation coefficient (RSCC); (B) ligand size; (C) resolution; (D) prediction probability. The tests were run on three datasets, CMB, TAMC and CL, as explained in the text

