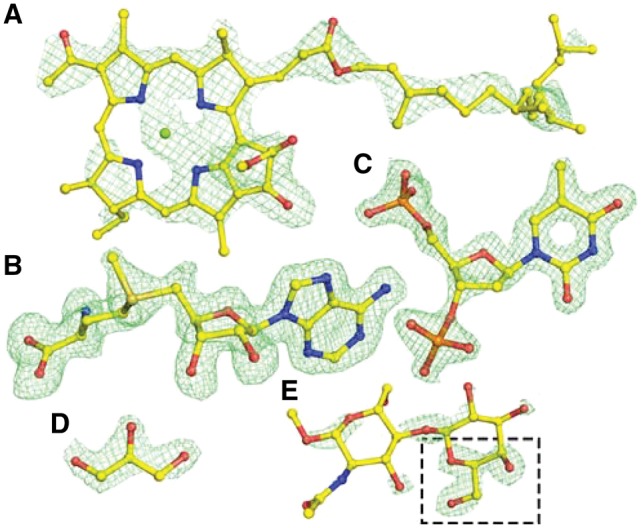
Fig. 5.

Examples of ligand identification in PDB deposits using CheckMyBlob. (A) 1OGV, bacteriochlorophyll A (BCL M 1303). (B) 3MB5, S-adenosyl-l-methionine (SAM A 301). (C) 4IUN, thymidine-3′,5′-diphosphate (THP A 202). (D) 5N0H, glycerol (GOL B 303). (E) 4Y1U, β-d-galactose (GAL B 201), misclassified by Check MyBlob as GOL (black frame). For each example, shown in green mesh are the isosurfaces of Fo-Fc maps contoured at 2.8σ, calculated after removal of solvent and other small molecules (including the ligand) from the model and five cycles of REFMAC5 (Murshudov et al., 2011) refinement. Atomic coordinates were taken from the PDB deposits (Color version of this figure is available at Bioinformatics online.)
