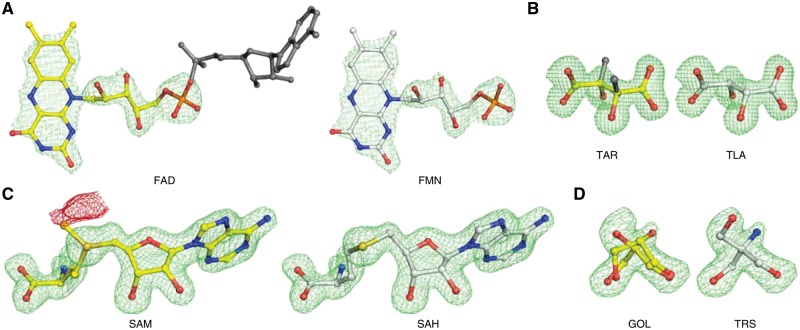
Fig. 6.
Examples of misidentified ligands detected in the PDB (left panels) with CheckMyBlob-assigned labels (right). (A) 2PDT (FAD D 204), flavin-adenine dinucleotide, reinterpreted by CheckMyBlob as flavin mononucleotide; the missing adenine fragment is shown in dark gray. (B) 1KWN (TAR A 501), the modeled atoms have the configuration of l(+)-tartaric acid (TLA) as identified by CheckMyBlob, whereas the deposition authors labeled this moiety (inconsistently with the real configuration of the ligand coordinates) as d(−)-tartaric acid (TAR), whose correct chirality is visualized in dark gray. (C) 1FPX (SAM A 1699), modeled as S-adenosyl-l-methionine (SAM), reinterpreted as S-adenosyl-l-homocysteine (SAH); the crystalized protein is an isoflavone O-methyltransferase, therefore, both the substrate and product may be present in the ligand binding site; however, there is a negative peak of Fo-Fc electron density (shown in red at -2.8σ) near the CE methyl carbon atom, making SAH much more probable. (D) 4RK3 (GOL A 401), electron density modeled as disordered glycerol and the same electron density interpreted as TRIS buffer. For each example, shown in this figure, the green mesh represents the isosurfaces of Fo-Fc maps contoured at 2.8σ, calculated after the removal of solvent molecules and other small-molecule moieties (including the ligand) from the model, followed by five cycles of REFMAC5 (Murshudov et al., 2011) refinement. Ligands identified by CheckMyBlob have been manually fitted using COOT (Debreczeni and Emsley, 2012) (Color version of this figure is available at Bioinformatics online.)

