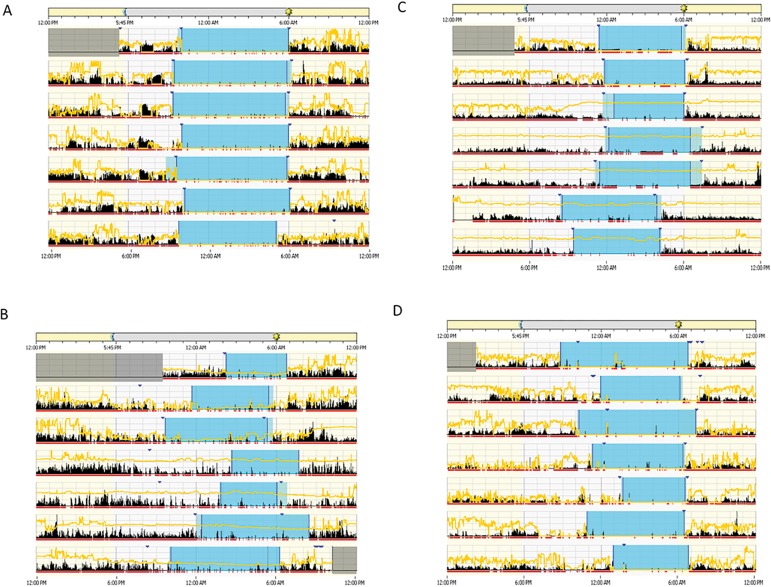
Figure 2.
Actograms showing activity data (vertical black bars) divided into light phase (daytime, from 6:00 a.m. to 5:45 p.m., beige horizontal bar on top) and dark phase (night time, from 5:45 p.m. to 6:00 a.m., gray horizontal bar on center top). Yellow lines represent the variation in light throughout the day (24h period). Horizontal red bar represents when individuals were awake, and blue area indicates sleep period, with the lighter blue area indicating rest, and dark blue arrow head representing when subjects pressed a button on Actiwatch 2 to mark when they went to bed and when they woke up in the morning. Graph (A) illustrates a healthy subject; (B) a diabetic subject showing high instability between days, (C) a diabetic subject showing low rhythm amplitude, and (D) a diabetic subject showing high fragmentation.

