Figure 2.
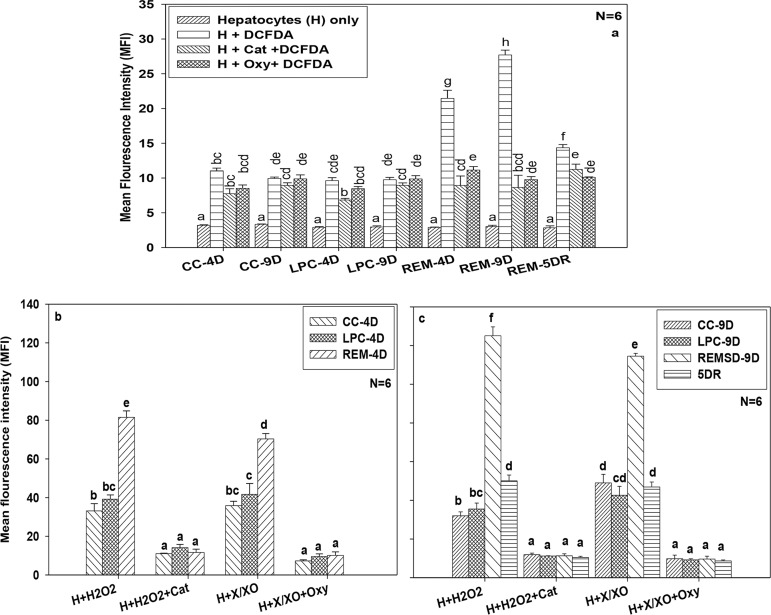
Effect of REM sleep deprivation on ROS production in hepatocytes. Measurement of ROS in hepatocytes from cage control, large platform control, REM sleep deprived group and recovery group of rats. (a), Measurement of ROS in different control groups and REM sleep deprived group of rats treated with scavengers like catalase and oxypurinol after 4 day, 9 days of REM sleep deprivation and 5day of sleep recovery. Differential productions of ROS in progression with REM sleep deprivation compared with control and simultaneously treated with catalase and oxypurinol after 4day of sleep deprivation (b), and 9 day of REMSD and 5day of sleep recovery after 9days of REMSD (c), similarly treated with catalase and oxypurinol. Each vertical bar represents the mean of 6 individual samples with standard error. Treatments that don't share a letter, are statistically different in Tukey post-hoc analysis followed by one way ANOVA across treatment groups. [CC=Cage control, LPC=Large platform control, REM= Rapid eye movement sleep deprivation. H=Hepatocytes, DCFDA= dichlorodihydrofluorescein diacetate, Cat= catalase (200U/ml), Oxy=Oxypurinol (50µM), X/XO=Xanthine/xanthine oxidase (50mU/ ml), H2O2=Hydrogen peroxide 200µM), 4D- after 4 days from start of experiment, 9D- after 9 days from start of experiment, 5DR- After 5 days of REM sleep recovery i.e. rats were allowed to sleep in cages for 5 days].

