
Figure 2.
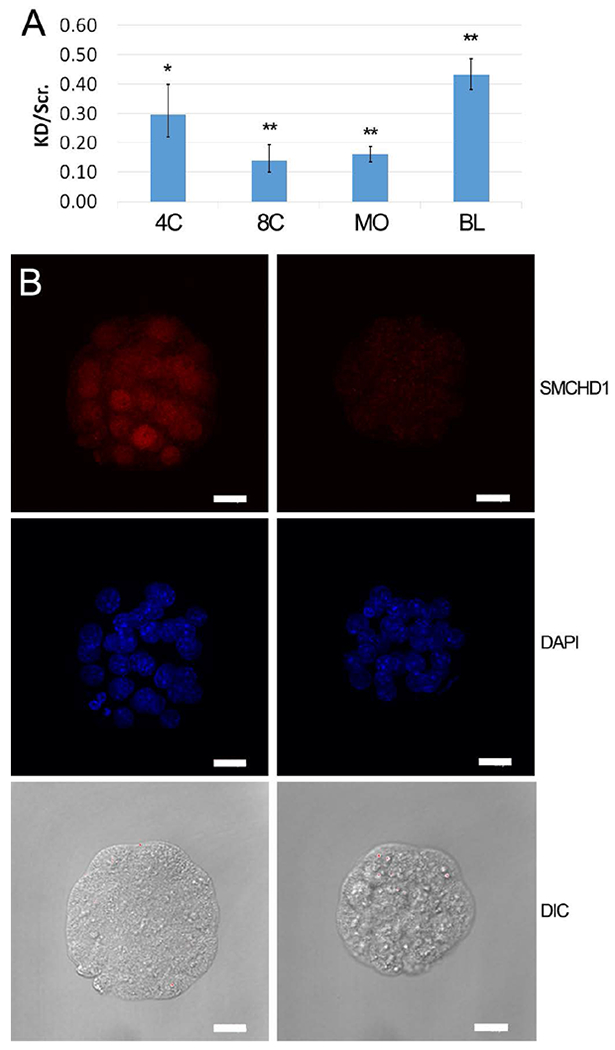
Confirmation of siRNA knockdown of SMCHD1. A: qRT-PCR analysis of Smchd1 mRNA fold expression ratio following zygotic microinjection of Smchd1 siRNA versus scrambled control siRNA. Data are the mean of the ratio (± s.e.m.) of knockdown: scrambled control injected embryos, calculated from 3 independent trials of 8-cell (n=20, 72 hphCG) and blastocyst (n=20,108 hphCG) stage embryos, and 5 independent trials of 4-cell (n=20, 66 hphCG) and morula (n=20, 92 hphCG) stage embryos. Statistical significance of difference between Smchd1 and scrambled control siRNA injected embryos was tested by two-tailed paired t-tests assuming equal variance and p-values were adjusted for multiple testing; (* indicates p <0.05; ** indicates p < 0.005). Relative expression values (RQs) were calculated using Ubtf as the internal reference gene. B: Immunofluorescence detection of SMCHD1 in morula stage embryos (92 hphCG) following zygotic microinjection of scrambled control and Smchd1 siRNA. Left panels, scrambled siRNA injection controls. Right panel, Smchd1 siRNA injected embryos. Representative images of embryos are shown. Knockdown was confirmed in seven independent replicate studies. Top row, SMCHD1 localization; Middle row, DAPI DNA staining; Bottom row, Differential interference microscopy images; Note also the smaller diameter, reduced nuclear dimensions, and cytoplasmic irregularities in the knockdown embryos (right) compared to scrambled siRNA controls (left). Note smaller embryo diameters and smaller nuclei in knockdown embryos (Table 4). Bar = 20 μm.