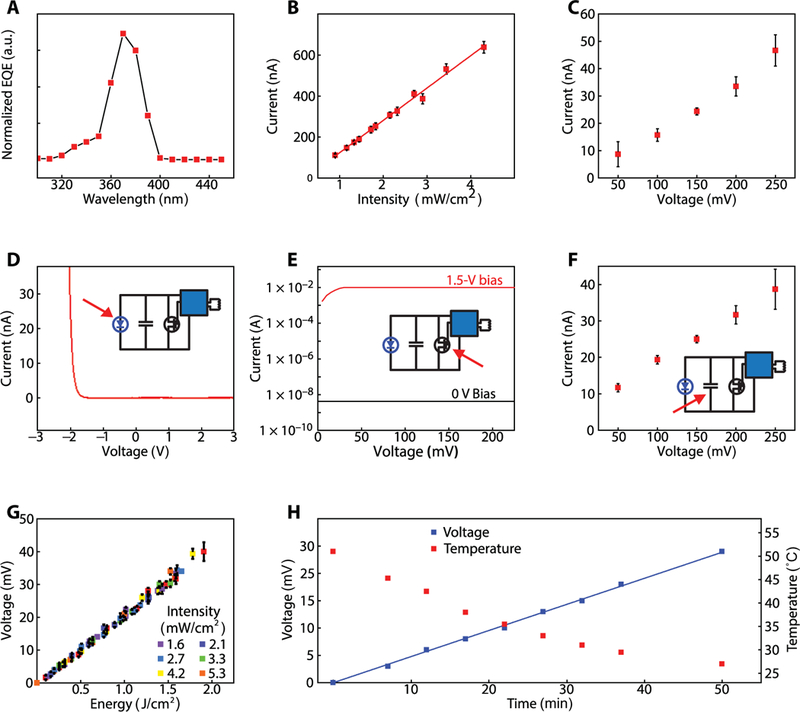
Fig. 2. Indoor characterization of millimeter-scale, battery-free UVA dosimeters.

(A) EQE of the UVA PD (n = 1). a.u., arbitrary units. (B) Mean photocurrent from the UVA PD (n = 3) as a function of the intensity of UVA exposure. The error bars represent SDs. (C) Mean system-level leakage current of dosimeter (n = 3) at increasing SC voltage in the dark. Measured leakage current is the current needed to maintain a constant voltage across SC. The error bars represent the SD. (D) Current-voltage response of the UVA diode (n = 1) measured in the dark. The inset is the circuit diagram of the system with an arrow indicating the UVA diode. (E) Drain current of the MOSFET (n = 1) at ON (1.5 V) and OFF (~0 V) gate biases as a function of voltage. The inset is the circuit diagram of the system with an arrow indicating the MOSFET. (F) Mean leakage current associated with the SC (n = 3). The error bars represent the SD. The inset is the circuit diagram of the system with an arrow indicating the SC. (G) Mean voltage output as a function of cumulative dose of UVA exposure. Dosimeter (n = 3) was irradiated with constant intensity over time at six different intensities. The error bars represent the SD. (H) Voltage output as a function of time of UVA exposure with constant intensity, as the device (n = 1) submerged in water is cooled from 50°C to room temperature over 50 min. Voltage and temperature readouts were wirelessly obtained every 5 min with an NFC reader antenna.
