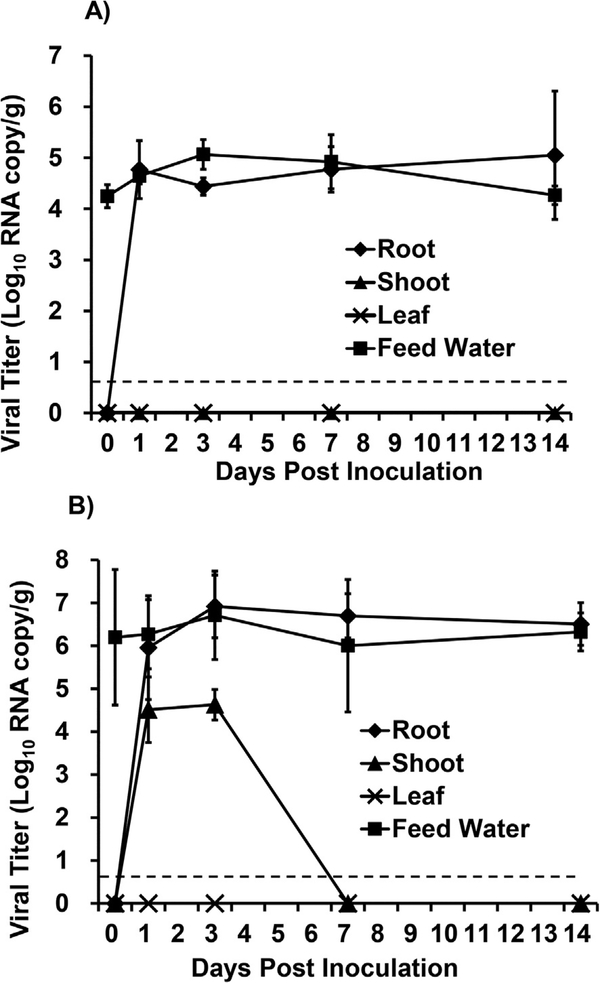
Fig. 4. TV RNA detection in hydroponically grown green onion given low (A) and high (B) inoculum.
Internalization kinetics plot was determined by RT-qPCR and results are reported as log10 RNA copies/g. Data points were the averages of six replicates. Error bars represent ±1 standard deviation. Dotted line represents the LOD.

