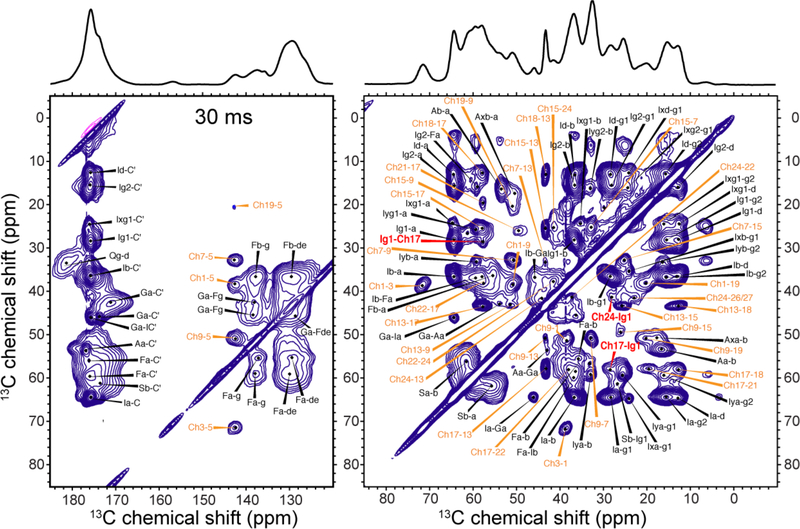
Figure 2.
30 ms 2D CC spectrum of IFGA-M2T and 1-13C CHOL in POPC/POPG membranes, showing full resonance assignment. The spectrum was measured at ~110 K under 13 kHz MAS with sensitivity enhancement by DNP. Significant spectral congestion is seen due to the large number of CHOL cross peaks in addition to the protein cross peaks. Cholesterol cross peaks are assigned in orange, protein cross peaks in black, and CHOL-M2 cross peaks in red.

