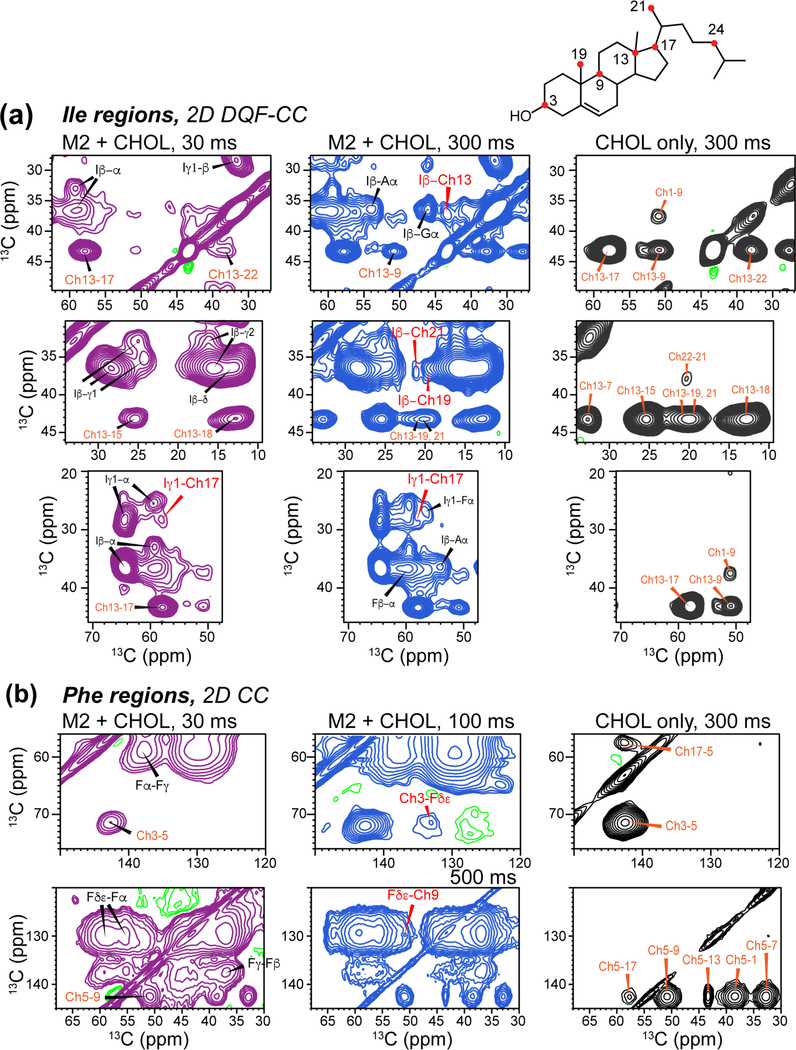
Figure 5.
Regions of 2D 13C-13C correlation spectra of IFGA-M2T and 1-13C CHOL in POPC/POPG membranes, showing protein-CHOL cross peaks. All spectra were measured at ~110 K under DNP condition. Left column shows 30 ms spectra (purple) where only short-distance contacts are detected. Middle column (blue) shows 300 ms spectra where longer-range cross peaks are detected. Right column (black) shows 300 ms spectra of the protein-free control membrane with 1-13C CHOL. (a) Aromatic region of the 2D spectra, showing a Phe Cγ-Ch15 cross peak. (b) Ile regions of the 2D spectra, showing cross peaks between Ile sidechain carbons and CHOL Ch13, Ch17, Ch19 and Ch21.

