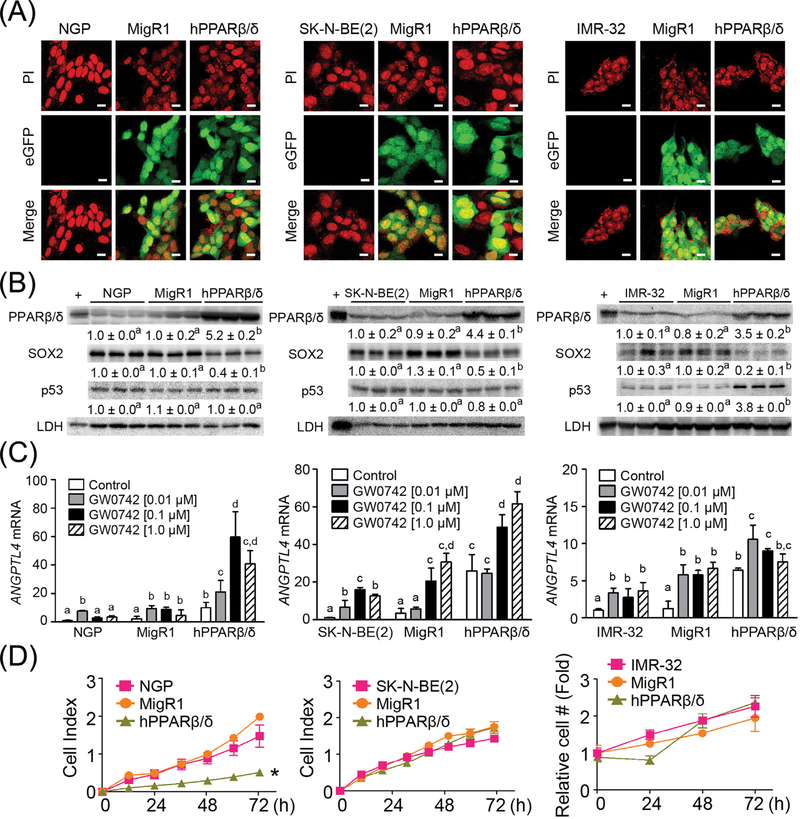
FIGURE 1.
Characterization of human neuroblastoma cell lines over-expressing PPARβ/δ. (A) Representative photomicrographs of NGP, NGP-MigR1 (MigR1, vector control) and NGP-hPPARβ/δ (hPPARβ/δ); SK-N-BE(2), SK-N-BE(2)-MigR1 (MigR1), and SK-N-BE(2)-hPPARβ/δ (hPPARβ/δ); or IMR-32, IMR-32-MigR1 (MigR1) and IMR-32-hPPARβ/δ (hPPARβ/δ) cells showing positive eGFP signals in MigR1 and hPPARβ/δ cells. PI: propidium iodide (stain for nucleus). Magnification = 600×. Bar = 10 μm. (B) Quantitative Western blot analysis of PPARβ/ δ, SOX2, and p53 expression. +: the positive control (cell lysate from COS1 cells transfected with human PPARβ/δ expression vector). (C) Relative ANGPTL4 mRNA expression in cells treated with or without the PPARβ/δ agonist GW0742 compared to NGP, SK-N-BE(2) or IMR-32 parent cells. (D) Real-time proliferation of NGP, NGP-MigR1, and NGP-hPPARβ/δ or SK-N-BE(2), SK-N-BE(2)-MigR1, and SK-N-BE(2)-hPPARβ/δ cells were examined using the xCELLigence system. Cell growth curve of IMR-32 cells was determined by counting cell numbers every 24 h. Relative cell number over time was normalized to the initial cell number and represents the fold change. Values represent the mean ± S.E.M. Values with different superscript letters are significantly different at P ≤ 0.05. *Significantly different than controls, P ≤ 0.05

