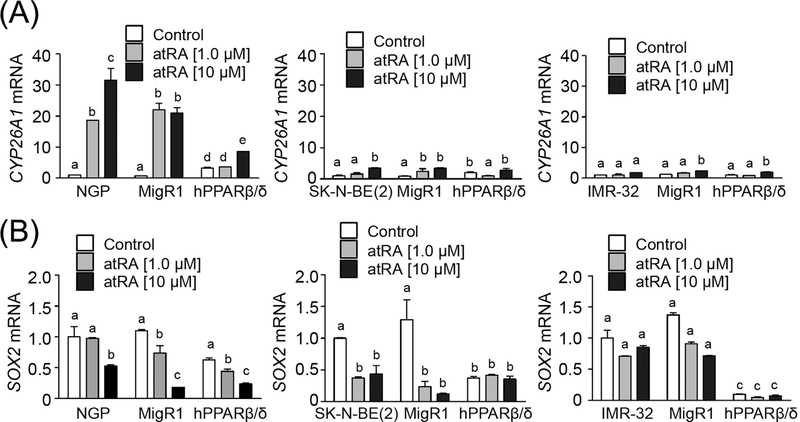
FIGURE 2.
Exposure to atRA decreases SOX2 mRNA expression in NGP and SK-N-BE(2) cells, but not in IMR-32 cells. (A) CYP26A and (B) SOX2 mRNA expression in cells treated with or without atRA. MigR1: cells with integrated MigR1 control vector; hPPARβ/δ: cells overexpressing PPARβ/δ. Values represent the mean ± S.E.M. Values with different superscript letters are significantly different at P ≤ 0.05

