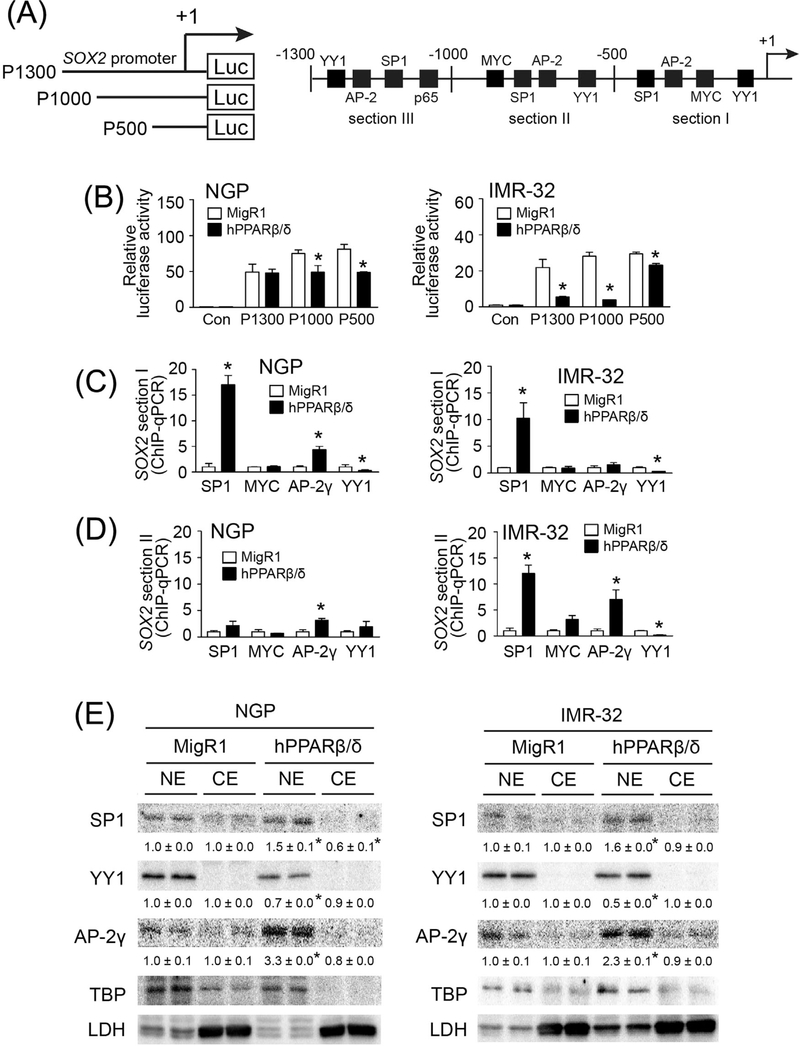
FIGURE 6.
PPARβ/δ-suppressed SOX2 expression is associated with altered activities of SP1, AP-2γ, and YY1 in neuroblastoma cells. (A) Left panel, three luciferase reporter constructs driven by the human SOX2 promoter with serial deletion; right panel, putative binding sites of trans-acting factors in the human SOX2 promoter. +1 represented the transcriptional start site. Section I, −1 to −500 bp region; section II, −500 to −1000 bp region; section III, −1000 to −1300 bp region of SOX2 promoter. (B) Relative luciferase activities of three luciferase reporter constructs in neuroblastoma cells with integrated MigR1 control vector (MigR1) and cells over-expressing PPARβ/δ (hPPARβ/δ). Control = Con. (C) ChIP-qPCR showing effect of PPARβ/δ on the occupancy of SP1, MYC, AP-2γ, and YY1 on the −1 to −500 bp region of SOX2 promoter in the indicated control cells or those over-expressing PPARβ/δ. (D) ChIP-qPCR showing effect of PPARβ/δ on the occupancy of SP1, MYC, AP-2γ, and YY1 on the −500 to −1000 bp region of SOX2 promoter in control cells or those over-expressing PPARβ/δ. (E) Differential expression of SP1, YY1, and AP-2γ in nuclear and cytosolic extracts of NGP-MigR1 and NGP-hPPARβ/δ cells or IMR-32-MigR1 and IMR-32-hPPARβ/δ cells were assessed by quantitative western blot analysis. NE, nuclear extract; CE, cytosolic extract. Values represent the mean ± S.E.M. *Significantly different than parent control group, P ≤ 0.05

