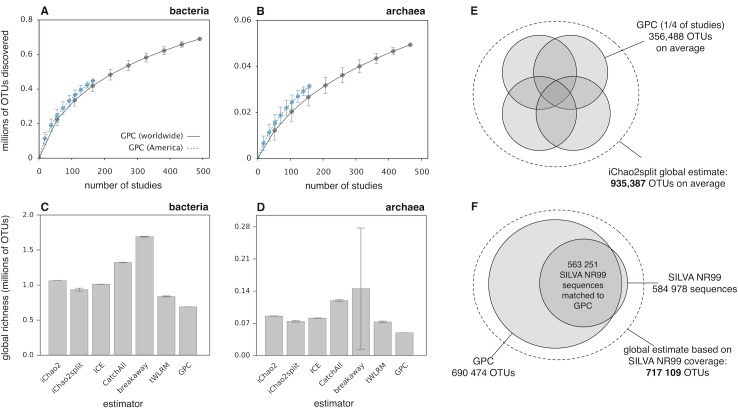
Fig 1. Estimating global prokaryotic OTU richness.
(A, B) Accumulation curves showing the number of bacterial (A) and archaeal (B) OTUs discovered, depending on the number of distinct studies included. Curves are averaged over 100 random subsamplings, and whiskers show corresponding standard deviations. Continuous curves were calculated using all studies (worldwide), while blue dashed curves were calculated using solely studies performed in the Americas or near American coasts. (C, D) Global OTU richness of Bacteria (C) and Archaea (D), estimated using the iChao2, iChao2split, ICE, CatchAll, breakaway, and tWLRM estimators. The number of OTUs discovered by the GPC is included for comparison (last bar). Whiskers indicate standard errors, estimated from the underlying models; most standard errors are likely underestimated by the models, so the variability between models is probably a more honest assessment of uncertainty. (E, F) Illustration of two methods used to estimate global bacterial OTU richness (dashed circle). (E) The iChao2split richness estimator is based on the numbers of OTUs discovered once, twice, thrice, or four times when studies are randomly split into four complementary "sampling units" (shaded circles). Average estimates were obtained by repeating the random split multiple times. (F) Based on the fraction of bacterial nonredundant (NR99) sequences in SILVA (right shaded circle) that could be matched to the GPC (left shaded circle), we estimated the fraction of global bacterial OTU richness represented in the GPC and, given the total number of bacterial OTUs in the GPC, the total number of extant bacterial OTUs. For analogous results at 99% clustering similarity, see S4 Fig. GPC, Global Prokaryotic Census; ICE, incidence coverage-based estimator; NR, nonredundant; OTU, operational taxonomic unit; tWLRM, transformed weighted linear regression model.

