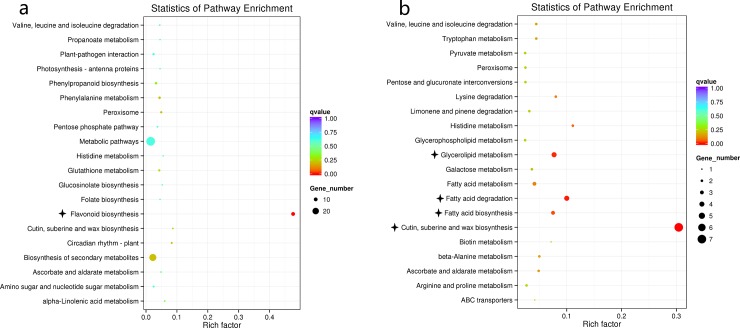
Fig 7.
Scatter plots of enriched Kyoto Encyclopedia of Genes and Genomes pathways based on down- (a) and up- (b) regulated differentially expressed genes (DEGs) in the developing seeds of near-isogenic yellow- and brown-seeded BC4S1 plants of Brassica rapa at 20 days after pollination. The most significantly enriched 20 pathways are presented. The size of the spherical indicates the number of DEGs. A lower q-value (corrected p-value) indicates greater enrichment of the pathway. KEGG pathways with q-value <0.05 are significantly enriched and labelled with black asterisk. The Rich factor is the ratio of the number of DEGs annotated to the number of all genes annotated in this pathway term. The greater the rich factor, the greater the degree of pathway enrichment.

