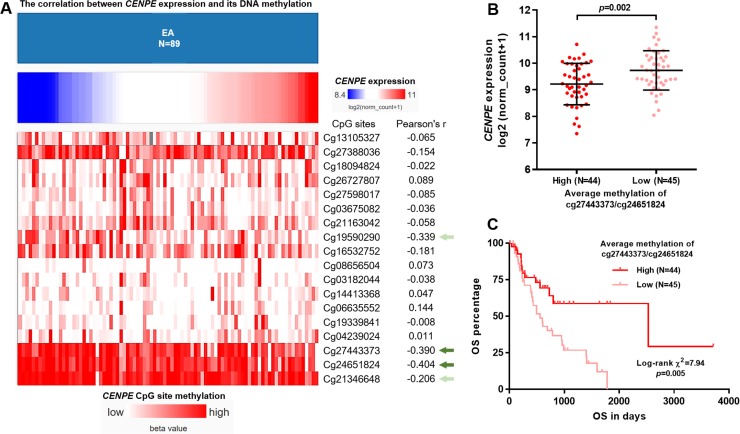
Fig 4. CENPE expression was negatively correlated with its DNA methylation in EA.
A. A heatmap showing the correlation (represented as Pearson’s r-value) between CENPE expression and the methylation status of the 18 CpG sites in CENPE DNA in EA. B. Comparison of CENPE expression between methylation-high and methylation-low groups, according to the median average methylation of cg27443373 and cg24651824. C. Kaplan-Meier curves of OS of methylation-high and methylation-low groups.

