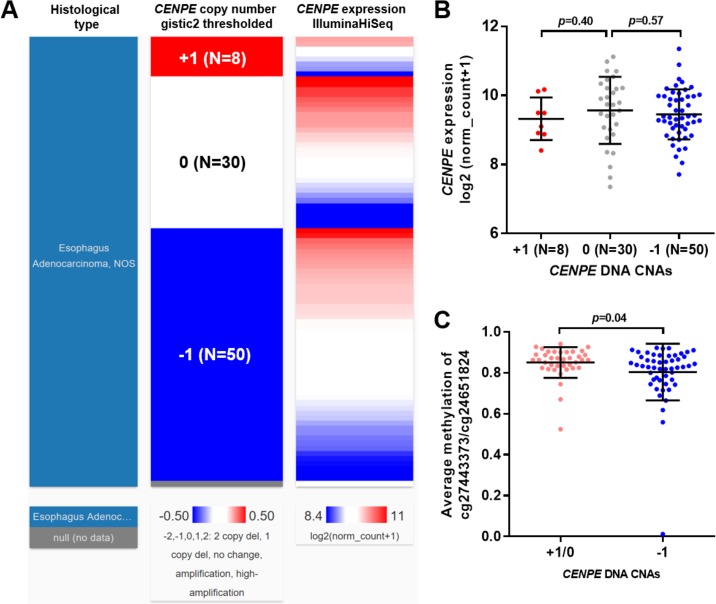
Fig 5. CENPE expression in EA was not related to its CNAs.
A-B. A heatmap (B) and a statistical comparison summary (B) showing the correlation between CENPE expression and the CENPE copy number alterations in EA (N = 88). C. Comparison of the average methylation of cg27443373 and cg24651824, between amplification (+1)/copy neutral (0) cases and heterozygous loss (-1) group.

