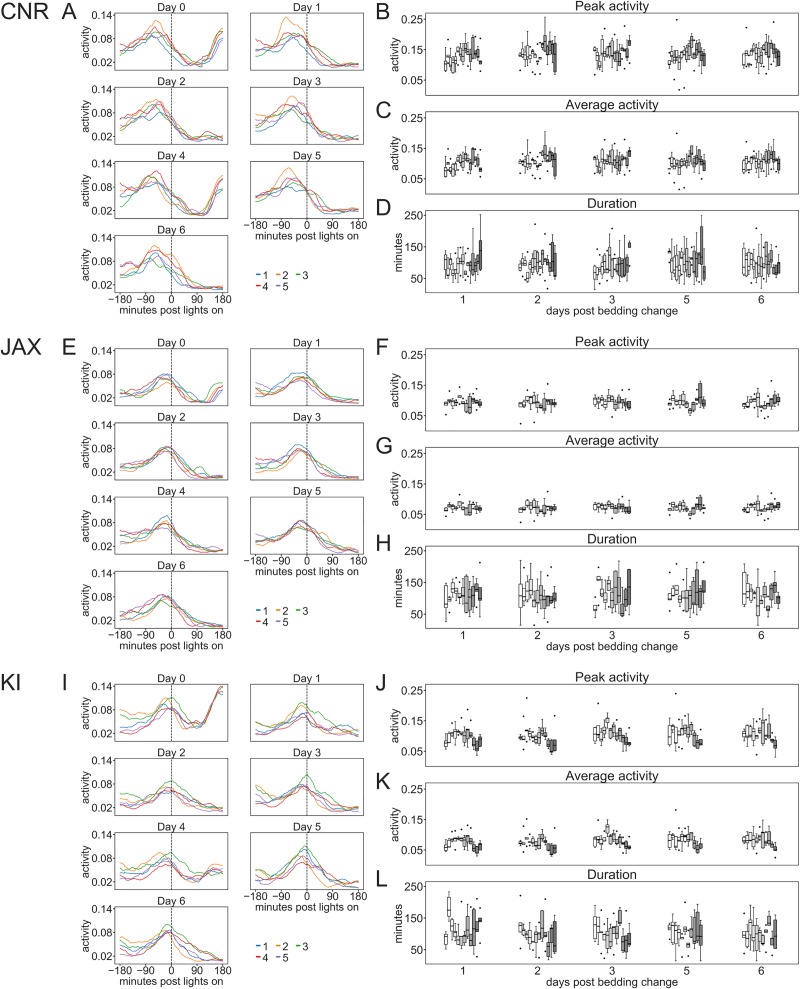
Fig 9. Impact by lights-on on activity at CNR, JAX and KI.
A, E and I Plots of average response of each cage across 8–13 weeks during each day of a cage-change cycle (0 is day of cage-change) with female mice at CNR (A), JAX (B) and KI (C). Peak-(B, F and J) and average activity (C, G and K) during the response duration, and the duration (FWHM) of the response (D, H and L) were calculated from such plots. Among the female mice the peak and average activation response (site factor, p<0.001) but not the duration of the response (p>0.05) were significantly different between sites and across weeks of observations but not weekday of the cage-changing cycle. Within sites peak- activation varied across weeks (p<0.03–0.001) while only at the KI site there was a significant variation in both peak- and average activity response with day in the cage-changing cycle (p<0.01).

