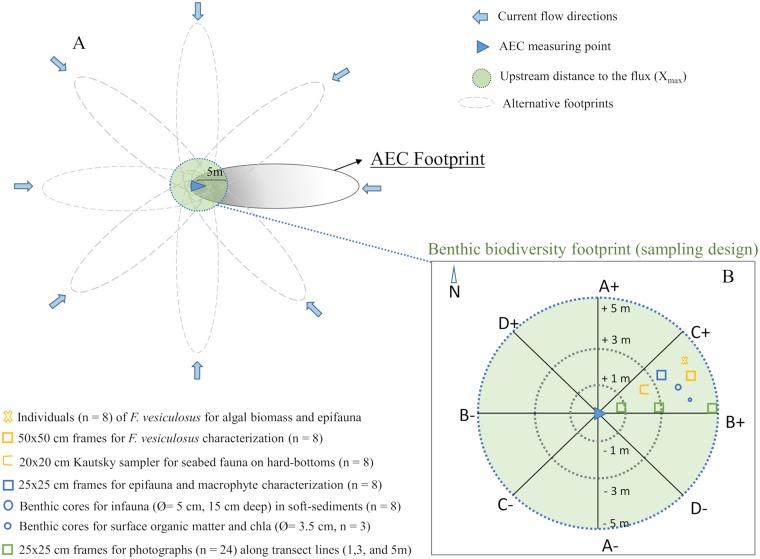
Fig 3. Schematic illustration of the AEC footprint and biodiversity sampling area.
(A) Diagram from above showing the AEC footprint areas determined by different flow directions. The length, width and total area of the AEC footprints for all the habitats are shown in Table 1. The circular biodiversity footprint (80 m2, r = 5 m) was superimposed to the AEC footprint ensuring that the maximum flux contribution measured in all the habitats (Xmax = 5 m) was covered. The grey scale shows a theoretical gradient of the benthic contribution to the flux registered within the footprint area (darker grey implies higher contribution closer to the device). (B) Illustration of the biodiversity footprint area displaying 8 equal wedge-sections for community characterization. Quantitative random samples (n = 8, one replicate sample per each of the 8 wedge-sections) of the main benthic organisms (v macrofauna, macrophytes and macroalgae) were collected (see Methods).

