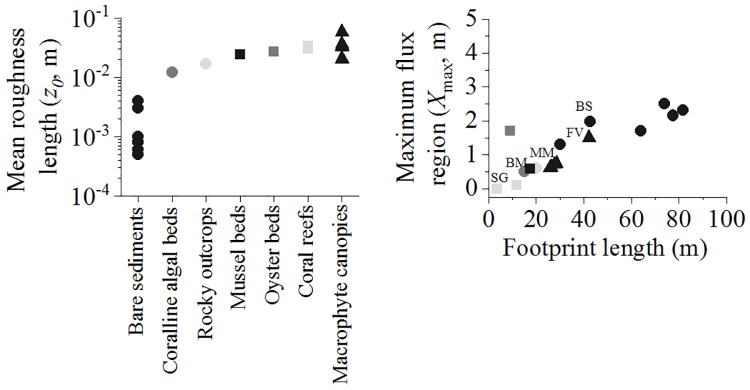
Fig 4. Estimated characteristics of the AEC footprint.
Mean roughness length (z0) and estimated footprint length versus region of maximum flux contribution (Xmax) for various coastal benthic habitats (Bare sediments: [27,29,31,32, this study]; Coralline algal bed: [27]; Rocky outcrop: [31]; Mussel bed: [this study]; Oyster bed: [20]; Coral reef: [33]; Vegetated canopy: [30,34, this study]). The estimated footprint values (length vs Xmax) for the study sites were allocated (i.e., BS: bare sand; MM: mixed macrophyte; SG: seagrass meadow; FV: bladder-wrack belt; BM: blue mussel).

