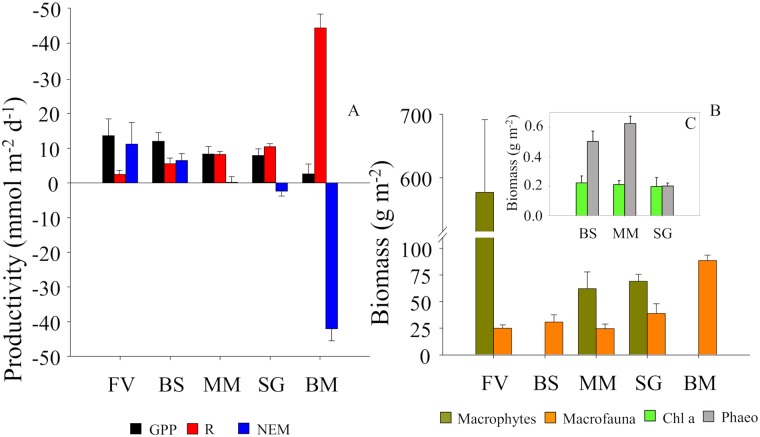
Fig 5. Mean (+SE) ecosystem metabolism and benthic biodiversity biomass.
(A) Ecosystem metabolism (GPP: gross primary production, R: community respiration, NEM: net ecosystem metabolism), (B) benthic biomass (dry weight) of macrophytes (Z. marina and Fucus vesiculosus) and macrofauna (total average), and (C) benthic biomass (dry weight) of chlorophyll a (Chl a) and phaeopigments (Phaeo) from all the habitats (FV: bladder-wrack bed, BS: bare sand, MM: mixed macrophyte, SG: seagrass meadow, BM: blue mussel reef). Different letters represent significant differences (p < 0.05) for the main metrics.

