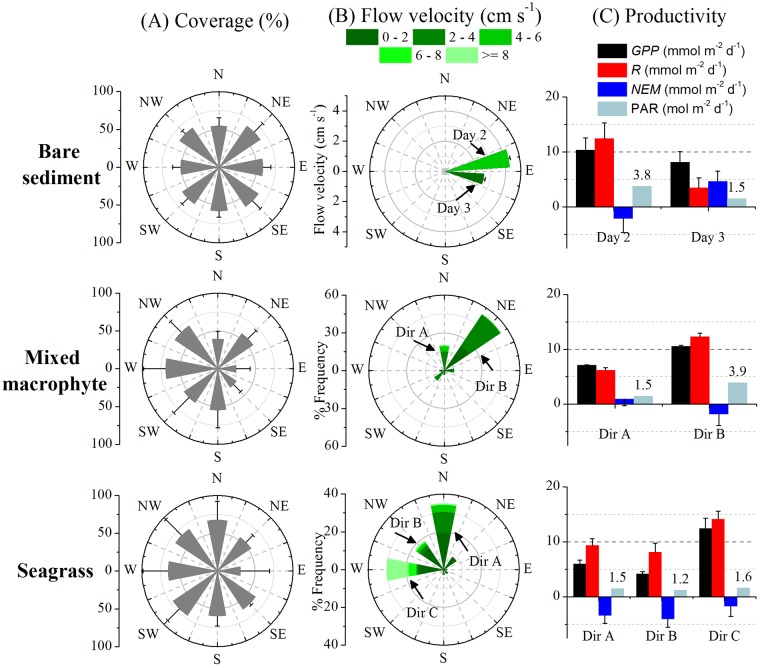
Fig 6. Windrose plots (mean ± SD) for the soft-sediment sites.
(A) Coverage (ArcMap, see section 2.7.) of benthic microalgae (i.e., chlorophyll a), macrophytes, and seagrass, (B) directional flow velocity distribution, and (C) daily seafloor productivity rates for different days or different directions (daily integrated PAR values are indicated).

