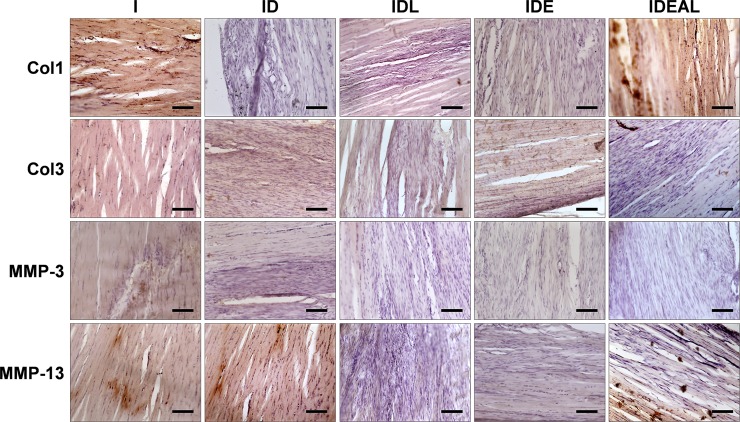
Fig 2. Effects of LPBM and exercise on expression of Col1, Col3, MMP-3 and MMP-13 AT proteins.
I, injured (n = 4); ID, injured diabetic (n = 4); IDL, injured diabetic plus LPBM (n = 4); IDE, injured diabetic plus aerobic exercise (n = 4); IDEAL, injured diabetic plus aerobic exercise and LPBM (n = 4). aP<0.05 vs I group; bP<0.05 vs ID group; cP<0.05 vs IDL group; dP<0.05 vs IDE group. Original magnification is x200 and bar is 100 μm.

