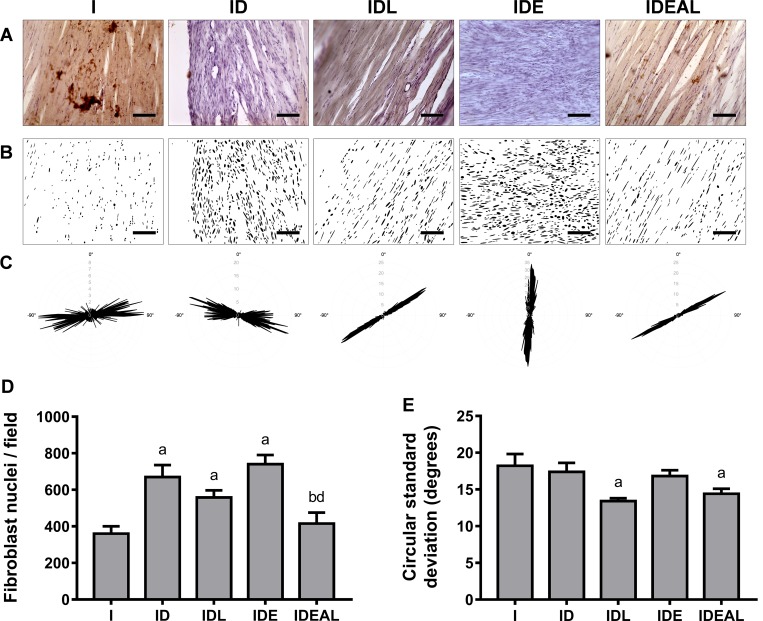
Fig 3. Effects of LPBM and exercise on fibroblast number and orientation in AT.
(A) Representative H/DAB-stained images. (B) Binary images containing the segmented nuclei after automated image processing. (C) Representative polar histograms depicting the angular distribution of individual nuclei. The length of the radius of the plot is proportional to angular frequencies. Angles were adjusted for a period of −90° to 90° along the horizontal x-axis. Results of fibroblast nuclei (D) number per histological field and (E) alignment. I, injured (n = 4); ID, injured diabetic (n = 4); IDL, injured diabetic plus LPBM (n = 4); IDE, injured diabetic plus aerobic exercise (n = 4); IDEAL, injured diabetic plus aerobic exercise and LPBM (n = 4). aP<0.05 vs. I group; bP<0.05 vs. ID group; cP<0.05 vs. IDL group; dP<0.05 vs. IDE group. Original magnification is x200 and bar is 100 μm.

