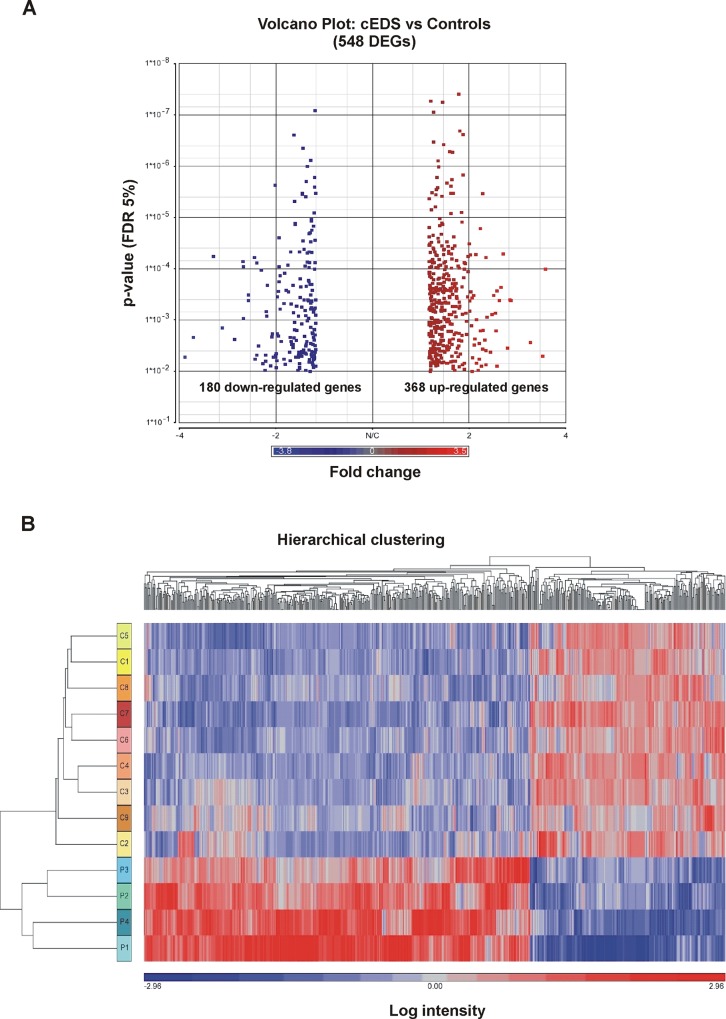
Fig 1. Volcano plot and hierarchical clustering analyses for DEGs in skin fibroblasts from cEDS patients and control subjects.
(A) The volcano plot depicts all statistically significant 548 DEGs (180 down-regulated, 368 upregulated) identified in cEDS cells. The fold-change of DEGs on the x-axis vs the statistical significance (FDR-adjusted p-value <0.05) on the y-axis is shown; the up-regulated genes are reported in red, and the down-regulated genes are in blue. (B) Hierarchical clustering analysis of DEGs identified in cEDS fibroblasts. Although fibroblasts from only 9 control subjects (C) and 4 cEDS patients (P) were analyzed, this analysis showed the presence of two distinct clusters of transcripts that clearly distinguish the patients from the healthy individuals. The red color represents high gene expression, and blue represents low gene expression.

