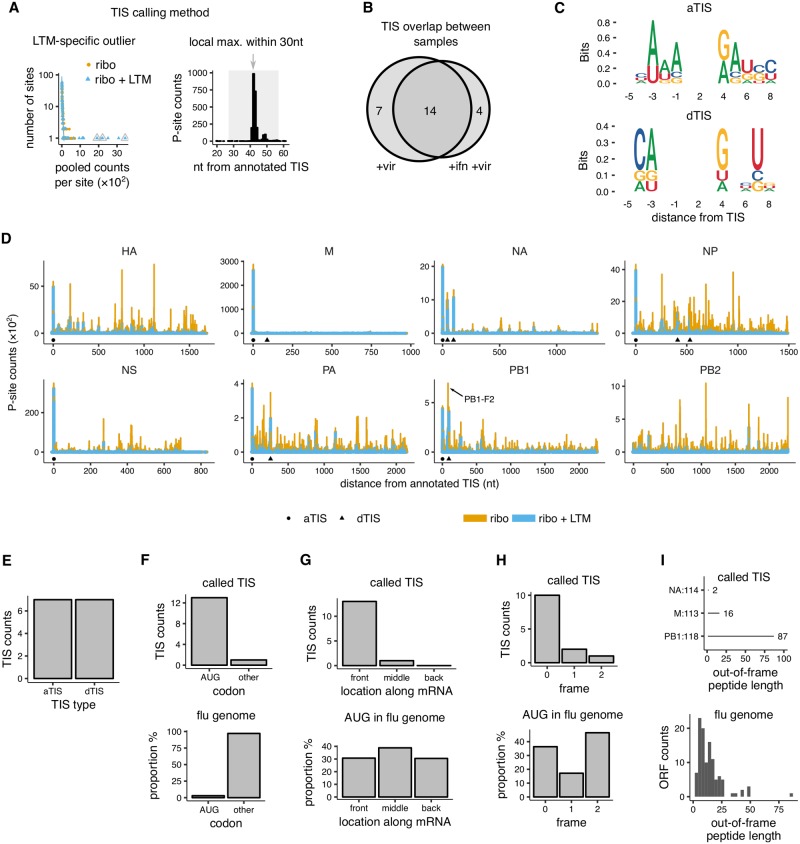
Fig 3. Candidate translation initiation sites on influenza transcripts.
(A) Method for identifying candidate translation initiation sites (TIS) in influenza. Left panel: LTM-specific outliers were identified over the background of Ribo-seq and Ribo-seq + LTM pooled counts at each site of each influenza transcript. Right-panel: Among LTM-specific outliers, only the highest LTM peak in P-site counts within each 30 nucleotide window was called as start site. The background Ribo-seq and Ribo-seq + LTM counts were fit to separate zero-truncated negative binomial distributions (lines in left panel). The final called TIS are indicated by grey triangles and arrows. The left panel shows the NA segment of our +vir sample and the right panel a window around the NA43 TIS. See S8 Fig for other influenza segments. (B) Overlap in candidate TIS between the +vir and +ifn +vir samples. (C) Consensus motif of annotated translation initiation sites (aTIS, upper panel) and downstream translation initiation sites (dTIS, lower panel). (D) P-site counts from Ribo-seq and Ribo-seq + LTM assays are shown for all 8 influenza genome segments for our +vir sample. The counts from the two assays are shown as stacked bar graphs for ease of comparison. The candidate annotated TIS (circle) and downstream TIS (triangle) are indicated below the coverage plots. The known alternate initiation site PB1-F2 is highlighted with arrow. Note that the plot for NP shows the aggregated results over the two synonymously recoded NP variants; see Fig 4 for results broken down by NP variant. (E) Number of called annotated and downstream TIS. (F) Distribution of codon identity for candidate influenza TIS (top) and for all codons in influenza genome (bottom). Other indicates all non-AUG codons. (G) Distribution of AUG codons along transcripts for candidate influenza TIS (top) and for all AUG codons (bottom). The codon locations were binned into three fragments of equal length for each influenza CDS. (H) Distribution among reading frames for candidate downstream TIS (top) and for all AUG codons in the influenza genome (bottom). (I) Length of peptides initiated by called out-of-frame TIS (top) and all out-of-frame AUG codons in the influenza genome (bottom). Only the candidate TIS shared between the +vir and +ifn +vir samples were used for panels C–I.

