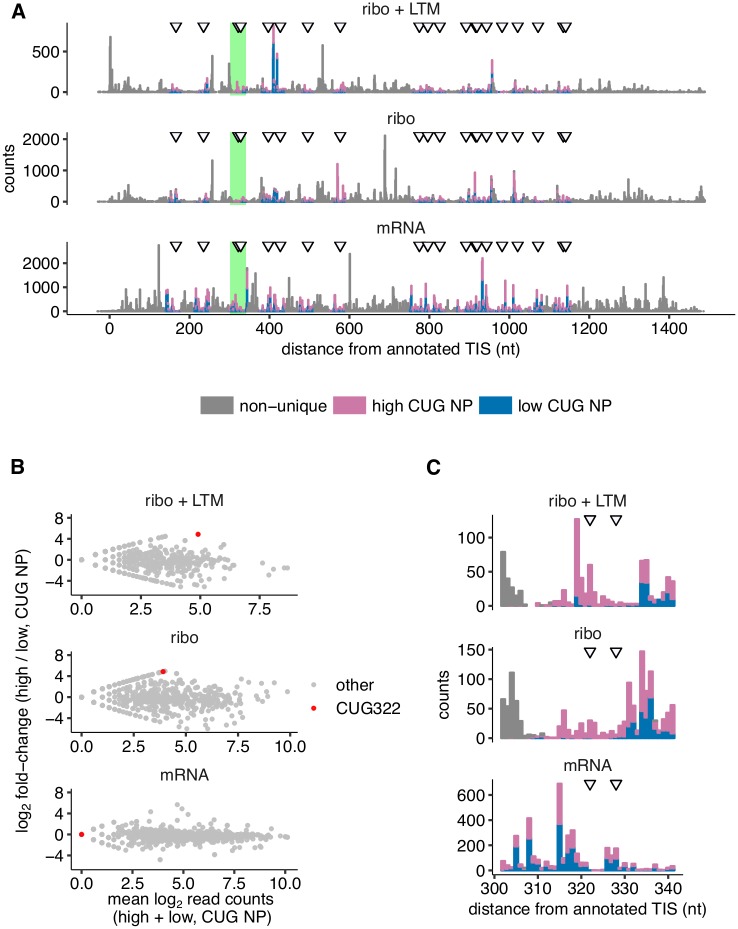
Fig 4. Translation initiation at CUG codons in influenza nucleoprotein.
(A) Coverage of Ribo-seq + LTM, Ribo-seq, and RNA-seq reads that can be uniquely aligned to either the high CUG NP variant or the low CUG NP variant, along with reads that cannot be uniquely assigned. P-site counts are shown for Ribo-seq and Ribo-seq + LTM assays. 5’-end counts are shown for RNA-Seq. Data are plotted as a stacked bar graph. Locations of the 20 CUG codons that are present in high CUG NP and synonymously mutated in low CUG NP are indicated by arrows. (B) The ratio of high CUG NP to low CUG NP coverage from panel A is plotted against their sum along the horizontal axis. (C) The green-highlighted region in panel A around the CUG322 codon is shown at greater horizontal magnification. Data shown for +vir sample. See S15 Fig for +ifn +vir sample.

