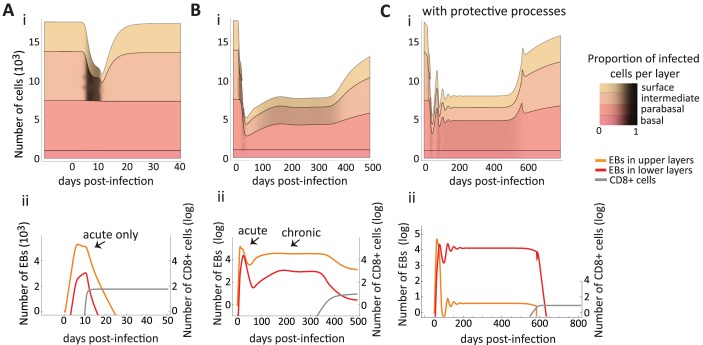
Fig 3. Simulated population dynamics of epithelial cells, immune effectors and bacteria in chlamydia infections.
In A, the immune cell proliferation is rapid, which leads to an acute infection. In B and C, immune cells do not proliferate fast enough to clear the bacteria and the acute phase is followed by oscillations and the establishment of a chronic phase (plateau of EB density). The infection is lytic reducing the thickness of the epithelium (A, B and C) but only chronic infections manage to infect the lower layers (B and C). Parameter values are default (Table 3 and literature values in Table 1) except in A where βb = 8.0 × 10⁻⁷ cell−1⋅ EB−1⋅ day−1, βp = 4.0 × 10⁻⁶ cell−1⋅ EB−1⋅ day−1, βu = 2.0 × 10⁻⁵ cell−1⋅ EB−1⋅ day−1, and φ = 0.0015 day−1. In C, all four epithelial protective measures happen together, i.e. ζu, ρb, μ, and ν all rise logistically to a threshold above default after infection to mimic the protective epithelial response (see section A.3 S1 Text, eqn 7a with θ = 1). Thresholds used in C: , , μmax = 0.9 cell−1⋅ day−1, and νmax = 0.8 day−1.

