Abstract
Setting: Following the operational research study conducted during the isoniazid preventive therapy (IPT) pilot phase in Zimbabwe, recommendations for improvement were adopted by the national antiretroviral therapy (ART) programme.
Objectives: To compare before (January 2013–June 2014) and after the recommendations (July 2014–December 2015), the extent of IPT scale-up and IPT completion rates, and after the recommendations the risk factors for IPT non-completion, in 530 ART clinics.
Design: Retrospective cohort study.
Results: People living with the human immunodeficiency virus newly initiating IPT increased every quarter (Q), from 585 in Q 1, 2013 to 4246 in Q 4, 2015, with 5648 new IPT initiations in the 18 months before the recommendations compared to 20 513 in the 18 months after the recommendations were made. The number of ART clinics initiating IPT increased from 10 (2%) in Q 1, 2013 to 198 (37%) in Q 4, 2015. Overall IPT completion rates were 89% in the post-recommendation period compared with 81% in the pilot phase (P < 0.001). After adjusting for confounders, being lost to follow-up from clinic review visits 1 year prior to IPT initiation was associated with a higher risk of not completing IPT, while having synchronised IPT and ART resupplies was associated with a lower risk.
Conclusions: Implementation of recommendations from the initial operational research study have improved IPT scale-up in Zimbabwe.
Keywords: IPT, HIV, antiretroviral treatment, operational research, Zimbabwe
Abstract
Contexte : A la suite d'une recherche opérationnelle réalisée pendant la phase pilote du traitement préventif par isoniazide (TPI) au Zimbabwe, des recommandations visant à une expansion ont été adoptées par le programme national de traitement antirétroviral (TAR).
Objectifs : Dans 530 centres de TAR, comparer avant (janvier 2013 à juin 2014) et après les recommandations (juillet 2014 à décembre 2015), le degré d'expansion du TPI et ses taux d'achèvement, et après les recommandations, examiner les facteurs de risque de non achèvement.
Schéma : Cohorte rétrospective.
Résultats : Le nombre des personnes vivant avec le virus de l'immunodéficience humaine démarrant le TPI ont augmenté chaque trimestre de 585 pendant le premier trimestre de 2013 à 4246 pendant le quatrième trimestre de 2015, avec 5648 nouvelles mises en route du TPI dans les 18 mois avant les recommandations et 20 513 dans la période de 18 mois après les recommandations. Le nombre de centres de TAR mettant en route le TPI a augmenté de 10 (2%) au premier trimestre 2013 à 198 (37%) au quatrième trimestre 2015. Les taux d'ensemble d'achèvement du TPI ont été de 89% dans la période suivant les recommandations comparés à 81% pendant la phase pilote (P < 0,001). Après ajustement sur les facteurs de confusion, le fait d'être perdus de vue des consultations de suivi au centre 1 an avant la mise en route du TPI a été associé à un risque plus élevé de non achèvement du TPI, tandis que la synchronisation du renouvellement des fournitures du TPI et du TAR a été associée à un risque plus faible.
Conclusions: Les recommandations émanant de la recherche opérationnelle initiale ont amélioré l'expansion du TPI au Zimbabwe.
Abstract
Marco de referencia: El programa nacional de tratamiento antirretrovírico (TAR), tras una investigación operativa realizada durante la fase preliminar de aplicación del tratamiento preventivo con isoniazida (TPI) en Zimbabwe, adoptó las medidas de mejoramiento que se recomendaban.
Objetivos: Comparar en 530 consultorios de suministro del TAR la magnitud de la ampliación de escala del TPI y las tasas de compleción del mismo, antes (de enero del 2013 a junio del 2014) y después (de julio del 2014 a diciembre del 2015) de la puesta en práctica de las recomendaciones, y después de su adopción, examinar los factores de riesgo de no completar el TPI.
Método: Fue este un estudio de cohortes retrospectivo.
Resultados: El número de personas infectadas por el virus de la inmunodeficiencia humana que iniciaban el TPI aumentó en cada trimestre, de 585 en el primer trimestre del 2013 a 4246 en el cuarto trimestre del 2015; se contabilizaron 5648 nuevos inicios del TPI en los 18 meses que precedieron la aplicación de las recomendaciones y 20 513 casos en los 18 meses que siguieron a la puesta en práctica de las mismas. El número de consultorios de TAR que iniciaban el TPI aumentó de 10 (2%) en el primer trimestre del 2013 a 198 (37%) en el cuarto trimestre del 2015. La tasa de compleción global del TPI fue 89% en el período posterior a las recomendaciones, comparada con 81% en la fase preliminar (P < 0,001). Tras corregir con respecto a las variables de confusión, la pérdida durante el seguimiento en las citas de control en el consultorio durante el año anterior a la iniciación del TPI se asoció con un mayor riesgo de no completar el TPI; al contrario, la sincronización del suministro del TPI y el TAR se asoció con una disminución del riesgo.
Conclusión: La aplicación de las medidas recomendadas durante la investigación operativa inicial ha mejorado la ampliación de escala del suministro del TPI en Zimbabwe.
In 2011, the World Health Organization (WHO) released guidelines that recommended strengthening intensified tuberculosis (TB) case finding (ICF) and scale-up of isoniazid (INH) preventive therapy (IPT) among people living with the human immunodeficiency virus (PLHIV) who were enrolled in antiretroviral therapy (ART) clinics.1 These recommendations were based on the knowledge that HIV is the greatest risk factor for developing active TB in those with latent infection, with HIV-positive individuals at 20–40 times higher risk than HIV-negative individuals.1 They were also based on evidence showing that despite the TB-protective effect of ART, HIV-positive individuals still have an increased risk of developing active TB disease compared to those who are HIV-negative,2 and that IPT in combination with ART significantly lowers this risk.3–5
As Zimbabwe is one of the 30 countries with the highest burden of TB worldwide,6 and a large population of PLHIV7 at potential risk of developing active TB disease, the WHO ICF/IPT guidelines were adopted in 2012, followed by revision of recording and reporting tools as well as stakeholder sensitisation meetings at various levels of the health system. A feasibility assessment of ICF/IPT implementation was conducted over a 1-year period, from December 2012 to December 2013 initially in 10 established ART sites across the country, to explore various IPT health delivery models the country could use for subsequent national roll-out. In line with this feasibility assessment, an operational research (OR) study was conducted in April and May 2014 to assess IPT completion rates among PLHIV who had started INH over a 2-month period in Quarter (Q) 1, 2013.8 The findings showed IPT completion rates of 81%. Among those who did not complete IPT, risk factors included 1) IPT pill pick-up visits not synchronised with the 2/3-monthly antiretroviral (ARV) pill pick-up visits; 2) a previous history of missed clinic visits prior to ART initiation; and 3) being in pre-ART care.
Study results and recommendations from the OR findings were disseminated in June 2014, and were adapted by the National ART Programme (NAP). These included 1) agreement with national roll-out of IPT, supported by improved supply chain logistics for INH to ensure uninterrupted stocks; 2) prioritisation of those on ART and synchronised dispensing of INH and ARV pills; and 3) cohort-based tracking of patients on IPT in health facilities with an electronic patient monitoring system (ePMS), to enable assessment of completion rates. The monitoring was supplemented by periodic supportive visits to all implementing sites and regular national review meetings with all stakeholders.
To assess what happened after these interventions, we conducted a follow-up study among patients enrolled in ART clinics within the NAP in Zimbabwe and started on IPT between July 2014 and December 2015 using the same methodology as in the previous study.8 Specific objectives of this current study were 1) to compare, between period A (January 2013–June 2014, before the OR recommendations) and period B (July 2014–December 2015, after the OR recommendations), the number of PLHIV newly initiated and cumulatively initiated on IPT, the number and distribution of health facilities offering IPT and the number and proportion of PLHIV who completed a full course of IPT; and 2) to assess, for period B only (after the OR recommendations), factors associated with non-completion of IPT.
STUDY POPULATION, DESIGN AND METHODS
Study design
This was a retrospective cohort study using routine programme data.
Study setting
This study was conducted in 530 of 534 high-volume public ART clinics in Zimbabwe that were using a fully functional ePMS system for tracking individual patients. Four health facilities were excluded because they failed to comply with guidelines to submit their data backups to national level.
Intensified TB case finding, IPT initiation and enrolment in ART
The process of enrolment into HIV care, routine ICF and recording and reporting in Zimbabwe have been described in the previous study.8 While all patients enrolled in HIV care were eligible for IPT on exclusion of TB symptoms using the WHO's four symptom based TB screening tool, there have been changes over time. First, the NAP has gradually modified eligibility for starting ART: in 2013 the CD4 cell count threshold was ⩽350 cells/ml; this moved to ⩽500 cells/ml in January 2014, and remained as such during the period of the study. From 2016, Zimbabwe moved to the ‘HIV Treat All’ approach; however, this occurred after the current study was completed. Second, since the previous OR study and the recommendations that were made, supplies of the 6-month daily oral dose of INH (5 mg/kg body weight for adults or 10 mg/kg body weight for children) plus daily low-dose pyridoxine (25 mg/day) have been synchronised with the ARV resupplies until completion of prophylactic treatment to prevent unnecessary visits to the health facility. During clinic visits, patients are assessed for adherence through self-reports and pill counts, and they also undergo screening for TB. Those found to have developed active TB disease discontinue IPT and are treated for TB according to national TB guidelines.9 After completion of a 6-month course of IPT, patients become eligible again for another repeat course of IPT after 36 months, when TB risk again increases.
Patient sample
The study included all confirmed PLHIV enrolled in HIV treatment and care services, commenced on IPT between 1 January 2013 and 31 December 2015 and entered in the ePMS across 530 ART clinics nationwide.
Data variables, data source and data collection
The variables of interest were similar to those in the previous study.8 This time, however, data were obtained from the ePMS, and included information such as start dates for IPT and quantities of IPT pills dispensed throughout the 6-month course of prophylaxis. As data on pharmacy stock status by health facility are not entered in the ePMS, unlike the previous study we could not establish site-specific INH stock status throughout the period under study.
Statistical analysis
Data from all individual ePMS back-ups, which are in MySQL database format (Oracle International Corporation, Redwood City, CA, USA) were imported into Stata v 15.1 (Stata Corporation, College Station, TX, USA) prior to data cleaning and statistical analysis. Frequencies and proportions were generated for categorical variables. Variables that produced a P value of <0.25 for χ2 associations with IPT non-completion were included in the multivariate log-binomial regression model for determining risk factors associated with IPT non-completion. Results were presented as relative risks (RRs) with 95% confidence intervals, and level of significance was set at 5% (P < 0.05).
Ethics
Ethics approval was granted locally by the Medical Research Council of Zimbabwe and internationally by the Ethics Advisory Group of the International Union Against Tuberculosis and Lung Disease, Paris, France. As only secondary data were used, informed patient consent was not required.
RESULTS
Scale-up in uptake of IPT and comparisons of IPT completion rates
The number of PLHIV in ART clinics newly initiated on IPT was lowest in Q 1, 2013, at 585, but increased every quarter to a high of 4246 new initiations by Q 4, 2015 (Figure 1). Overall, during period A there were 5648 new IPT initiations, compared to 20 513 during period B. The numbers of PLHIV cumulatively started on IPT reached 5648 during the 18 months of period A, and increased to 26 161, a five-fold increase, during the 18 months of period B (Figure 2). In addition to the numbers of PLHIV initiated on IPT, there were also increases in the number of sites offering IPT over time. Of the 530 established ART clinics, the number offering IPT increased from 10 to 92 (2–17%) during period A and from 92 to 198 (17–37%) during period B (Figure 3). Compared to Q 1, 2013 in period A, when the IPT completion rate was 81%, the IPT completion rates for period B increased significantly to 89% overall (P < 0.001), with a peak of 97% in Q 1, 2015 and a trough of 71% in Q 4, 2015 (Figure 4).
FIGURE 1.
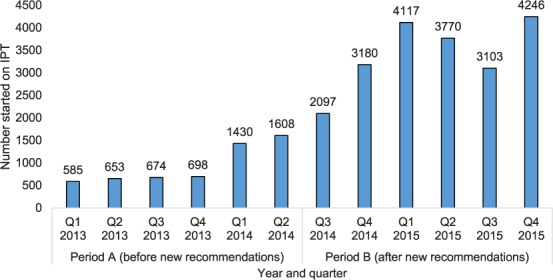
Number of PLHIV already enrolled in public ART clinics and newly initiated each quarter on IPT in Zimbabwe, January 2013–December 2015. IPT = isoniazid preventive therapy; Q = quarter; PLHIV = people living with the human immunodeficiency virus; ART = antiretroviral therapy.
FIGURE 2.
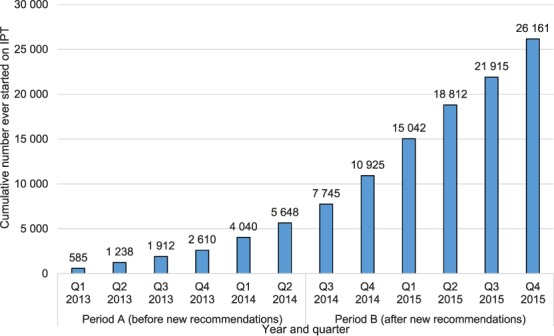
Cumulative number of PLHIV ever started on IPT at public ART clinics in Zimbabwe, January 2013–December 2015. IPT = isoniazid preventive therapy; Q = quarter; PLHIV = people living with the human immunodeficiency virus; ART = antiretroviral therapy.
FIGURE 3.
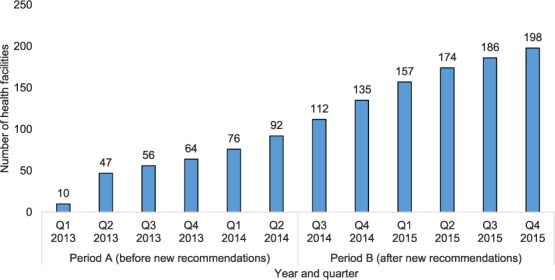
Cumulative number of selected ART clinics with access to the ePMS offering IPT in Zimbabwe, January 2013–December 2015. Q = quarter; ART = antiretroviral therapy; ePMS = electronic Patient Monitoring System; IPT = isoniazid preventive therapy.
FIGURE 4.
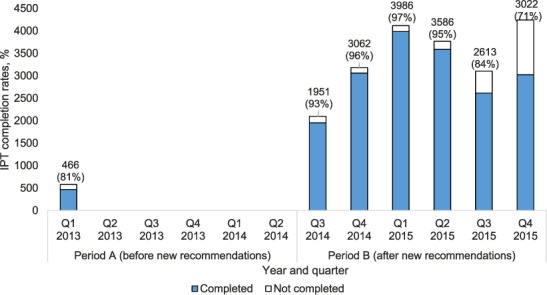
Number and proportion of PLHIV enrolled in ART clinics and started on IPT who completed IPT, January 2013–December 2015.* * There were no data on IPT completion rates for Q2 2013–Q2 2014. IPT = isoniazid preventive therapy; Q = quarter; PLHIV = people living with the human immunodeficiency virus; ART = antiretroviral therapy.
Demographic and clinical characteristics of PLHIV starting IPT between July 2014 and December 2015
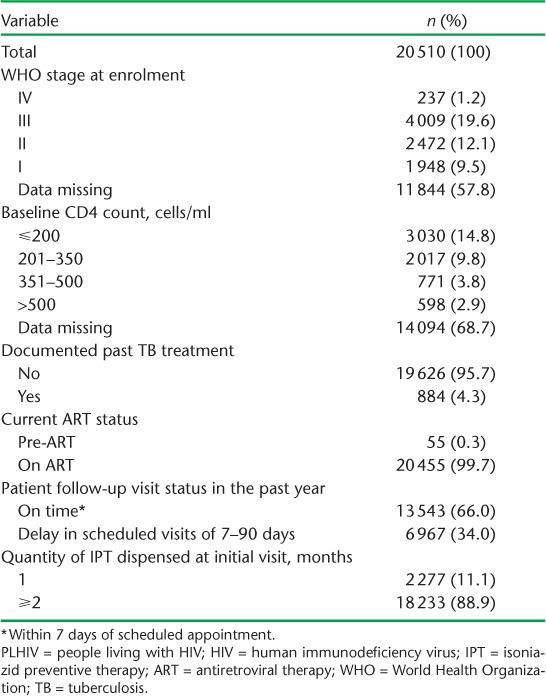
The demographic and clinical characteristics of PLHIV who started on IPT during period B (July 2014–December 2015) are shown in Tables 1 and 2, respectively. The median age of those started on IPT was 38 years (interquartile range [IQR] 30–46); the majority were females (66%), of whom 236 (2%) were pregnant. Half of the patients were accessing care at secondary-level hospitals and 44% were at primary care facilities. A documented past history of TB was recorded for 884 (4%) participants, and <1% were in pre-ART care. A history of loss to follow-up from ART in the year prior to IPT initiation was recorded for 6967 (34%) patients. A high proportion (89%) of PLHIV on IPT initially received an IPT supply of ⩾2 months.
TABLE 1.
Demographic characteristics of PLHIV commenced on IPT in ART clinics with the electronic Patient Monitoring System in Zimbabwe, 1 July 2014–31 December 2015
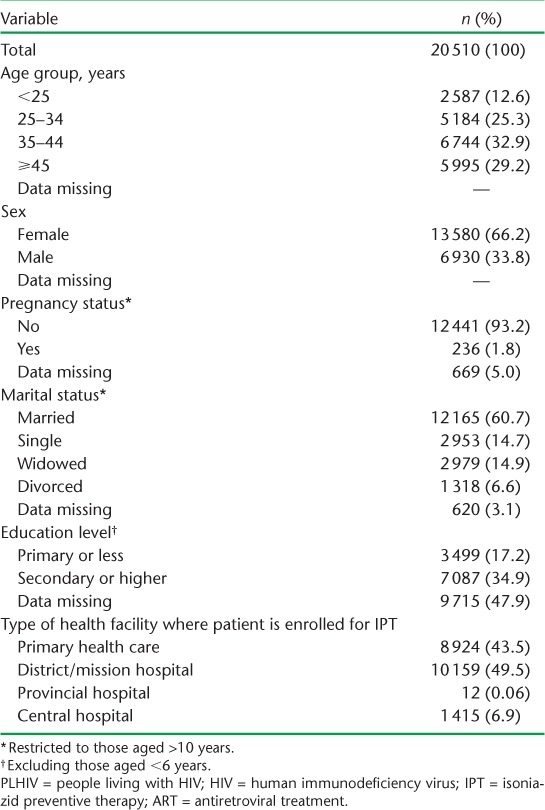
TABLE 2.
Clinical characteristics of PLHIV commenced on IPT in ART clinics with the electronic Patient Monitoring System in Zimbabwe, July 2014–December 2015
Risk factors associated with non-completion of IPT
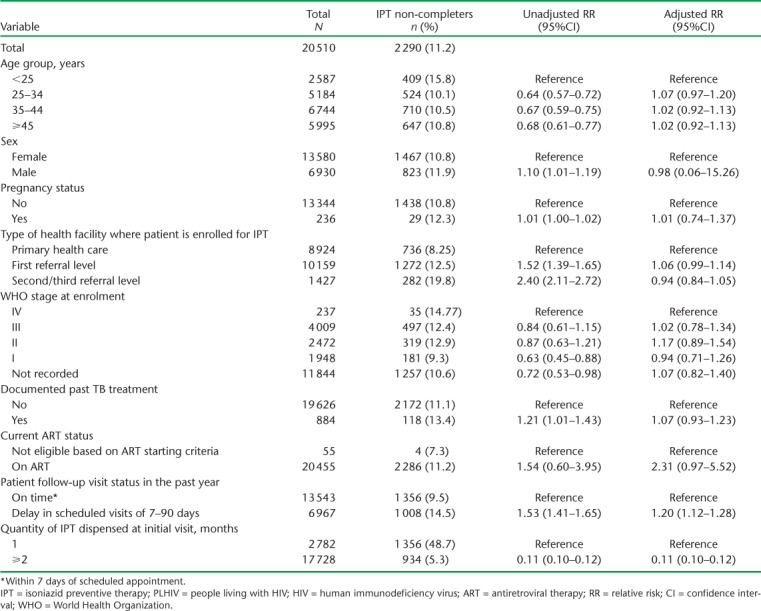
Risk factors for non-completion of IPT are shown in Table 3. Similar to the previous study, having a history of loss to follow-up from clinic review visits in the year prior to IPT initiation was associated with a higher risk of not completing the 6-month course of IPT, while synchronising the IPT and ARV resupplies was associated with a lower risk of not completing the 6-month IPT course.
TABLE 3.
Risk factors associated with non-completion of IPT among PLHIV enrolled in ART clinics with the electronic Patient Monitoring System, Zimbabwe, July 2014–December 2015
DISCUSSION
This study shows notable improvements in Zimbabwe's national IPT programme following the adoption of recommendations by the Zimbabwe HIV Care and Treatment Programme that arose from the OR study conducted during the feasibility phase of IPT in the 10 pilot sites.8 There were significant increases in PLHIV started on IPT, and in the number of health facilities offering IPT over time. Notably, in line with recommendations, the HIV Care and Treatment programme was able to conduct routine quarterly cohort-based assessments of IPT completion rates in health facilities based on the ePMS system. Progress is underway in these health facilities to have a dashboard on the ePMS system that readily reports IPT completion rates to inform immediate follow-up or tracing of those patients with poor completion rates or who may be lost to follow-up. For those health facilities that do not have access to the ePMS (which were not included in the study), there is monthly reporting of aggregate IPT indicators, including number of PLHIV screened for TB, number eligible for IPT, number started on IPT and number who completed their 6-month IPT course.
In line with recommendations, there was an increase in the proportion of patients who had the correct quantity of IPT dispensed and clinic review visits synchronised with ART resupplies, from 58% in the pilot study to 89% in the current study.8 This correlated with an improvement in overall IPT completion rates from 81% to 89% in the current study compared to the previous study.8 Although a higher proportion of PLHIV had a history of loss to follow-up from ART in the current compared to the previous study,8 this did not in general lower IPT completion rates; this may be attributed to targeted enhanced adherence counselling, which has been shown to improve ART adherence in those who are not virally suppressed.10 There was also a decline in the proportion of PLHIV started on IPT while in pre-ART care between the previous and current study, from 5% to <1%, although this probably coincided with a shift in the ART eligibility criteria from ⩽350 cells/ml to ⩽500 cells/ml: these policy changes may also have led indirectly to improved IPT completion rates compared with the previous OR study.11–13
Of concern were the declining IPT completion rates, which were at 84% in Q 3, 2015 and 71% in Q 4, 2015, as shown in Figure 4. We do not know the precise reasons for this, which might be due to data quality issues or to discontinuation of IPT following anecdotal reports of IPT toxicity by health workers. While adverse drug reactions are routinely reported to the national level, they may not be routinely reported through the Adverse Drug Reaction (ADR) reporting system as has been recommended. These are all areas that require further OR.
The strengths of this study are two-fold. First, the same methodology was employed in this follow-up study as in the previous study, thus enabling an assessment of the impact of changes in practice following the initial study. Second, the current study had a large sample size with wide geographic coverage and representation of the different tiers of the public health system in Zimbabwe, making the study results generalisable to the entire country. Study limitations included missing data for some variables and no data on IPT stock levels, as they required abstraction from paper-based records at ART clinics under assessment. Furthermore, no qualitative assessment was done concurrently to provide information on reasons for not completing IPT.
In conclusion, this study demonstrates that OR can play a pivotal role in evidence-based decision making. Recommendations were made following the initial OR study on IPT implementation which could then be assessed in terms of impact on policy, practice and programmatic scale-up of IPT. This is an approach that should be taken up by health programmes as a means of identifying programmatic challenges through research and eventually putting in place interventions that can enhance the quality or coverage of health services.
Acknowledgments
Technical support in writing this paper was provided through the International Union Against Tuberculosis and Lung Disease (The Union), Paris, France. KCT is supported as an operational research fellow from the Centre for Operational Research at The Union.
Footnotes
Conflicts of interest: none declared.
References
- 1.World Health Organization Guidelines for intensified tuberculosis case-finding and isoniazid preventive therapy for people living with HIV in resource-constrained settings. Geneva, Switzerland: WHO; 2011. [Google Scholar]
- 2.Gupta A, Wood R, Kaplan R, Bekker L-G, Lawn S D. Tuberculosis incidence rates during 8 years of follow-up of an antiretroviral treatment cohort in South Africa: comparison with rates in the community. PLOS ONE. 2012;7:e34156. doi: 10.1371/journal.pone.0034156. [DOI] [PMC free article] [PubMed] [Google Scholar]
- 3.Golub J E, Saraceni V, Cavalcante S C et al. The impact of antiretroviral therapy and isoniazid preventive therapy on tuberculosis incidence in HIV-infected patients in Rio de Janeiro, Brazil. AIDS. 2007;21:1441–1448. doi: 10.1097/QAD.0b013e328216f441. [DOI] [PMC free article] [PubMed] [Google Scholar]
- 4.Golub J E, Pronyk P, Mohapi L et al. Isoniazid preventive therapy, HAART and tuberculosis risk in HIV-infected adults in South Africa: a prospective cohort. AIDS. 2009;23:631–636. doi: 10.1097/QAD.0b013e328327964f. [DOI] [PMC free article] [PubMed] [Google Scholar]
- 5.Samandari T, Agizew T B, Nyirenda S et al. 6-month versus 36-month isoniazid preventive treatment for tuberculosis in adults with HIV infection in Botswana: a randomised, double-blind, placebo-controlled trial. Lancet. 2011;377:1588–1598. doi: 10.1016/S0140-6736(11)60204-3. [DOI] [PubMed] [Google Scholar]
- 6.World Health Organization Global tuberculosis report, 2017. Geneva, Switzerland: WHO; 2017. WHO/HTM/TB/2017.23. [Google Scholar]
- 7.Joint United Nations Programme on HIV/AIDS UNAIDS data 2017. Geneva, Switzerland: UNAIDS; 2017. [Google Scholar]
- 8.Takarinda K C, Choto R C, Harries A D, Mutasa-Apollo T, Chakanyuka-Musanhu C. Routine implementation of isoniazid preventive therapy in HIV-infected patients in seven pilot sites in Zimbabwe. Public Health Action. 2017;7:55–60. doi: 10.5588/pha.16.0102. [DOI] [PMC free article] [PubMed] [Google Scholar]
- 9.Ministry of Health and Child Care Zimbabwe TB Guidelines. Harare, Zimbabwe: MOHCC; 2010. [Google Scholar]
- 10.Bonner K, Mezochow A, Roberts T, Ford N, Cohn J. Viral load monitoring as a tool to reinforce adherence. J Acquir Immune Defic Syndr. 2013;64:74–78. doi: 10.1097/QAI.0b013e31829f05ac. [DOI] [PubMed] [Google Scholar]
- 11.World Health Organization Antiretroviral therapy for HIV infection in adults and adolescents: recommendations for a public health approach. 2010 Revision. Geneva, Switzerland: WHO; 2010. [PubMed] [Google Scholar]
- 12.World Health Organization Consolidated guidelines on the use of antiretroviral drugs for treating and preventing HIV infection: recommendations for a public health approach. Geneva, Switzerland: WHO; 2013. [PubMed] [Google Scholar]
- 13.World Health Organization Guidelines on when to start antiretroviral therapy and on pre-exposure prophylaxis for HIV. Geneva, Switzerland: WHO; 2015. [PubMed] [Google Scholar]


