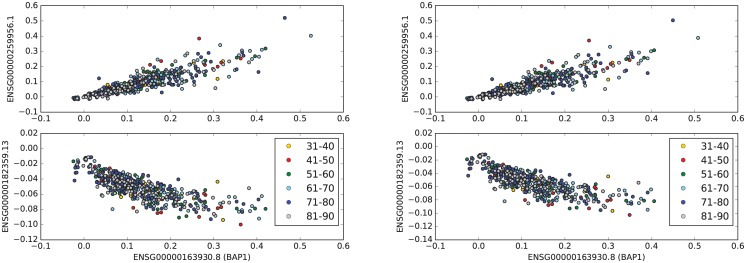
Fig 4. Highly correlated genes with BAP1 in COAD.
The top sub-figure shows the scatter plot of the values of BAP1 and the gene, which has the maximum positive correlation with BAP1 in the entire colon cancer data set. The bottom sub-figure shows the scatter plot of the values of BAP1 and the gene, which has the maximum negative correlation with BAP1 in all patients with colon adenocarcinoma. The right panel shows the exact same scatter plot as the left panel using n-normalization.

