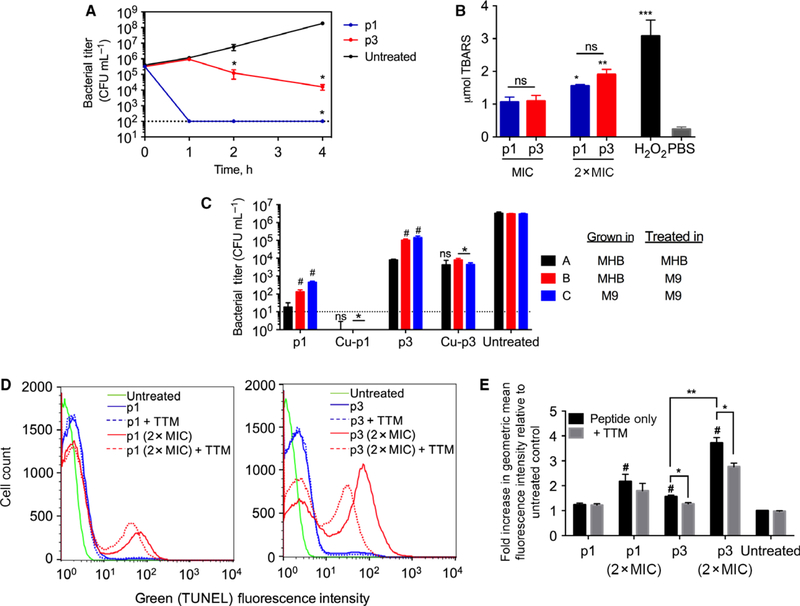
Fig. 4.
Activity of p1 and p3 against planktonic bacteria. (A) Time-kill kinetics curves of piscidin-treated E. coli. The dotted line represents the limit of detection of CFU enumeration (mean ± SEM, n = 3 duplicates). (B) E. coli cells were treated with p1 or p3 at the indicated concentrations and subsequently harvested for peroxidized lipid quantification using a standard assay measuring thiobarbituric acid reactive substances (TBARS). *P < 0.05; **P < 0.01; ***P < 0.005 compared to the PBS control. ns = not significant. Bars represent mean ± SEM (n = 3 duplicates). (C) E. coli cells were grown in either complex (MHB) or minimal media (M9 + glucose) and treated with peptides at their MIC for 30 min (p1 and p1-Cu) or 4 h (p3 and p3-Cu), based on the time-kill traces in (A). The limit of detection for the assay is shown by the dotted line; bars for p1-Cu fall below this limit. Data represent mean ± SEM (n = 3 duplicates). ns = not significant; *P < 0.05 compared to corresponding nonmetallated peptide; #P < 0.05 compared to condition A. (D) Representative histograms obtained from flow cytometric analysis of piscidin-treated E. coli. The fluorescence intensity is directly proportional to the amount of DNA strand breaks. (E) The geometric mean fluorescence intensity from (D) was normalized against that of the untreated cells (assigned a value of 1). Bars represent mean ± SEM (n = 3 duplicates). *P < 0.05, **P < 0.01, and #P < 0.05 compared to untreated control.

