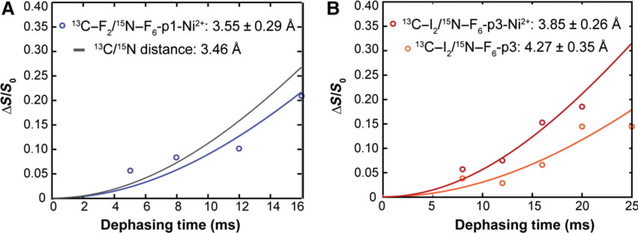
Fig. 8.
Spectroscopic characterization of DNA-piscidin interactions via solid-state NMR. Distance measurements obtained by solid-state NMR for the hydrogen-bond between 13C-carbonyl of Phe-2 and 15N-amide of Phe-6 in p1 (A) and between the 13C-carbonyl of Ile-2 and 15N-amide of Phe-6 in p3 (B) in the presence of Ni2+. For p1, the simulated line for 3.46 Å corresponds to the fit to the previously measured distance in the absence of Ni2+ [23]. For p3, the Ni2+-free data are plotted in lighter red. Error bars were calculated from the signal-to-noise ratio in the NMR spectra.

