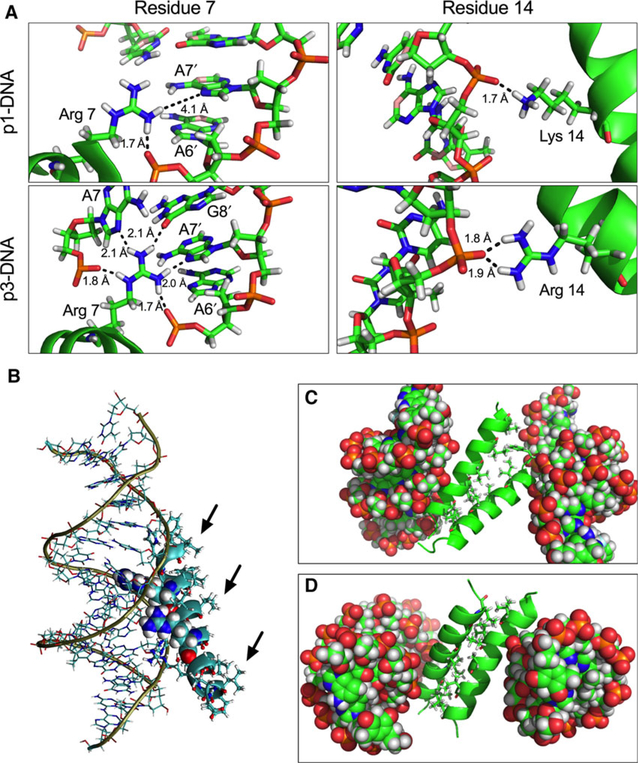
Fig. 9.
Molecular dynamics simulations of DNA-piscidin interactions. (A) Extensive hydrogen-bonding network formed by the 7th and 14th residue in p1 (top panels) and p3 (bottom panels) with both the phosphate backbone and the major groove surface of the DNA bases. Hydrogen-bonding distances are shown in Angstroms. (B) Depiction of the most stable configuration of the p3-DNA complex. The bases in the duplex are shown as lines, Arg7 and Arg14 are shown as spheres. The other p3 side chains are displayed as sticks while the backbone appears as a ribbon. The amino end of the peptide is closer to the DNA backbone than the carboxylic end. (C and D) Exposure of the hydrophobic residues of p3 (black arrows) contributes to aggregation. The most stable configurations of (p1-DNA)2 (C) and (p3-DNA)2 (D) show that the hydrophobic face of the peptides interacts via hydrophobic zippering during oligomerization. DNA is shown as spheres while the peptide backbones appear as ribbons. Hydrophobic residues of the peptides are displayed as sticks.

