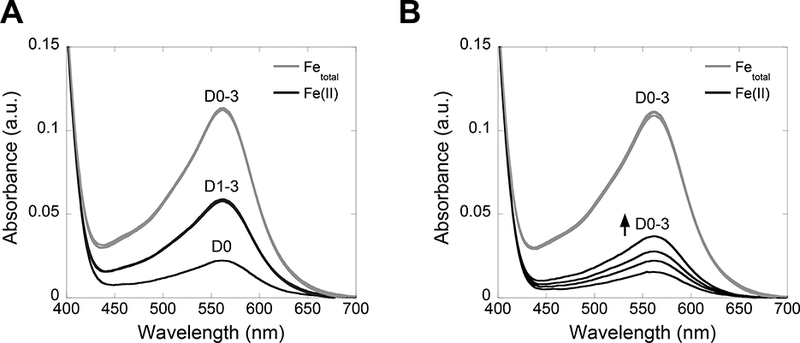
Figure 6.

Absorbance profiles of mCP (A) and hCP-Ser (B) samples analyzed by the Fe speciation assay. Spectra obtained for the Fetotal quantification samples (tubes labeled A, gray traces) and the Fe(II) quantification samples (tubes labeled B, black traces) over days 0–3 (D0–3) are shown.
