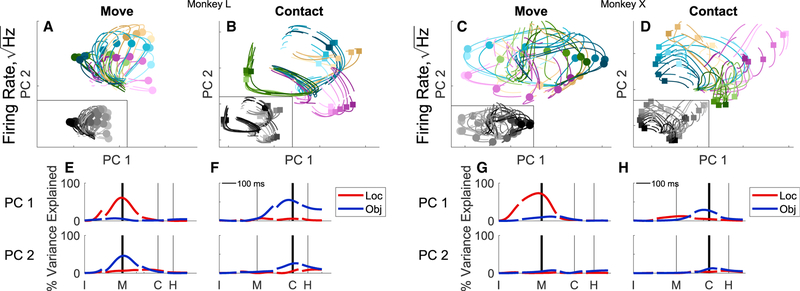
Figure 4. Time-Specific PCs of the Location and/or Object Partition.
For each monkey (L, left; X, right), PCs were derived from the data at two particular time points, as follows: movement onset and peripheral object contact. The trajectories for each of the 24 location and/or object combinations then have been projected into the plane of the first two move PCs (A and C) and the first two contact PCs (B and D), respectively. Colors are the same as Figure 3 with insets showing gray scale to emphasize location (lightest, 0; darkest, 157.5). Location, object, and location 3 object variance are shown as functions of time for PC1 (upper row) and in PC2 (lower row) of the move subspace (E and G) and of the contact subspace (F and H).

